


 Render [AntV Infographic](https://github.com/antvis/Infographic) visualizations directly in your Obsidian notes using fenced code blocks. ✨
## ✨ Features
- 🎨 **200+ Built-in Templates** - Process flows, timelines, hierarchies, charts, and more
- 📝 **Dual Syntax Support** - Use JSON configuration or AntV's declarative DSL
- 🖼️ **PDF Support** - Fully compatible with Obsidian's Export to PDF feature
- 🌓 **Theme Support** - Auto-detect or force light/dark mode
- 📐 **Responsive Design** - Automatic resize handling
- 🔄 **Live Reload** - Refresh all infographics with a single command
## 📦 Installation
### 🧪 Install via BRAT (Beta)
For beta/development versions, install using [BRAT](https://github.com/TfTHacker/obsidian42-brat):
1. Install [BRAT](https://github.com/TfTHacker/obsidian42-brat) from Community Plugins
2. Go to **Settings** → **BRAT** → **Add Beta Plugin**
3. Enter the repository URL:
```
https://github.com/shuuul/obsidian-infographic
```
4. BRAT will download and keep the plugin updated
5. Enable **Infographic** from Community Plugins
### Manual Installation
1. Download the latest release from [GitHub Releases](https://github.com/shuuul/obsidian-infographic/releases):
- `main.js`
- `manifest.json`
- `styles.css`
2. Create folder: `Vault/.obsidian/plugins/obsidian-infographic/`
3. Place the downloaded files in the folder
4. Reload Obsidian and enable the plugin
## 🚀 Usage
Create an infographic using a fenced code block with the `infographic` language:
### JSON Format
```infographic
{
"template": "list-row-simple-horizontal-arrow",
"data": {
"items": [
{ "label": "Step 1", "desc": "Start" },
{ "label": "Step 2", "desc": "In Progress" },
{ "label": "Step 3", "desc": "Complete" }
]
}
}
```
### DSL Format
```infographic
infographic list-row-simple-horizontal-arrow
data
items
- label Step 1
desc Start
- label Step 2
desc In Progress
- label Step 3
desc Complete
```
## 📋 Template Examples
### Timeline
```infographic
infographic sequence-timeline-rounded-rect-node
data
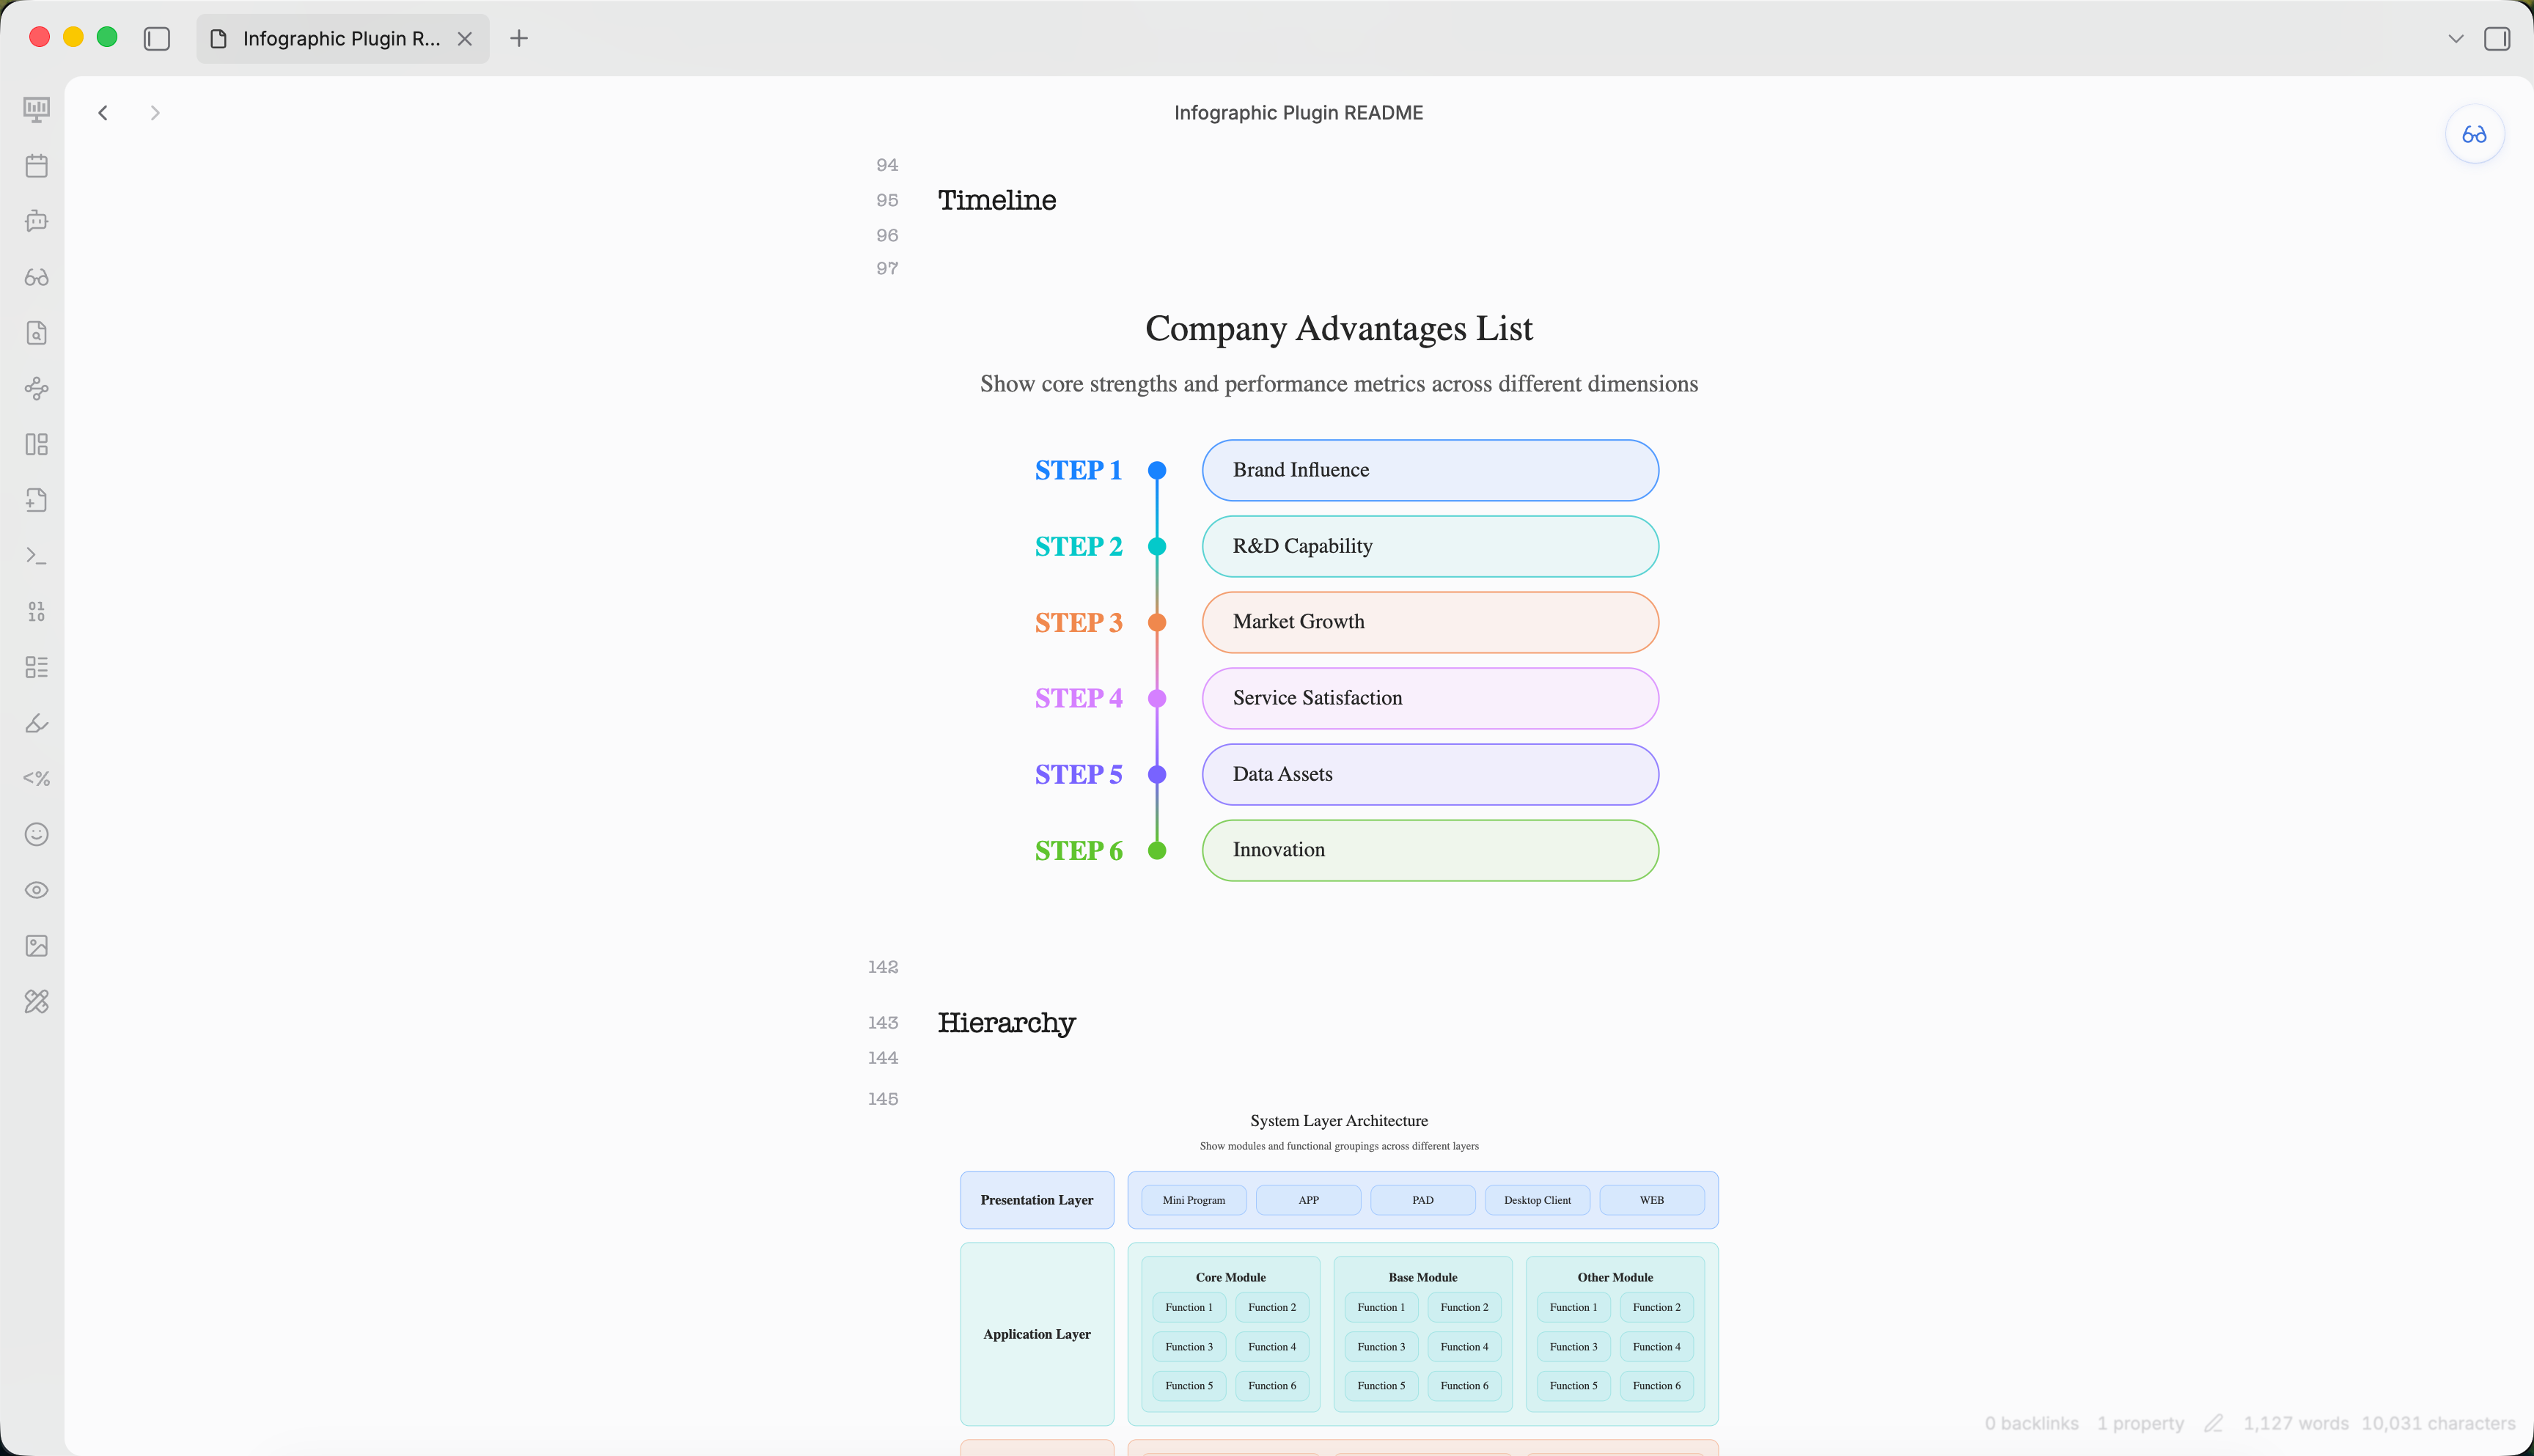
title Company Advantages List
desc Show core strengths and performance metrics across different dimensions
items
- label Brand Influence
value 85
desc Strong recognition and trust among target users
time 2021
icon mingcute/diamond-2-fill
illus creative-experiment
- label R&D Capability
value 90
desc Proprietary core systems with continuous innovation
time 2022
icon mingcute/code-fill
illus code-thinking
- label Market Growth
value 78
desc Rapid user base growth in the past year
time 2023
icon mingcute/wallet-4-line
illus business-analytics
- label Service Satisfaction
value 88
desc High ratings for overall service system
time 2020
icon mingcute/happy-line
illus feeling-happy
- label Data Assets
value 92
desc Complete user tagging and profiling system
time 2022
icon mingcute/user-4-line
illus mobile-photos
- label Innovation
value 83
desc New product launches exceed industry average
time 2023
icon mingcute/rocket-line
illus creativity
theme light
palette antv
```
### Hierarchy
```infographic
infographic hierarchy-structure
data
title System Layer Architecture
desc Show modules and functional groupings across different layers
items
- label Presentation Layer
children
- label Mini Program
- label APP
- label PAD
- label Desktop Client
- label WEB
- label Application Layer
children
- label Core Module
children
- label Function 1
- label Function 2
- label Function 3
- label Function 4
- label Function 5
- label Function 6
- label Base Module
children
- label Function 1
- label Function 2
- label Function 3
- label Function 4
- label Function 5
- label Function 6
- label Other Module
children
- label Function 1
- label Function 2
- label Function 3
- label Function 4
- label Function 5
- label Function 6
- label Platform Layer
children
- label Module 1
children
- label Function 1
- label Function 2
- label Function 3
- label Function 4
- label Module 2
children
- label Function 1
- label Function 2
- label Function 3
- label Function 4
- label Module 3
children
- label Function 1
- label Function 2
- label Function 3
- label Function 4
theme light
palette antv
```
### Comparison
```infographic
infographic compare-binary-horizontal-badge-card-fold
data
title Company Strengths vs Weaknesses
desc Present core strengths and areas for improvement in the market
items
- label Strengths
children
- label Strong R&D
desc Technology leadership with independent innovation
- label High Customer Retention
desc Over 60% repurchase rate, good reputation
- label Complete Service System
desc Fast after-sales response, high satisfaction
- label Weaknesses
children
- label Weak Brand Exposure
desc Insufficient marketing, awareness needs improvement
- label Limited Channel Coverage
desc Incomplete online channel layout
- label High Operating Costs
desc Labor and logistics costs above industry average
theme light
palette antv
```
### Chart
```infographic
infographic chart-bar-plain-text
data
title Annual Revenue Growth
desc Compare recent three years and current year targets (unit: 100M yuan)
items
- label 2021
value 120
desc Initial transformation, steady exploration
icon lucide/sprout
- label 2022
value 150
desc Platform optimization, significant efficiency gains
icon lucide/zap
- label 2023
value 190
desc Deep digital integration, comprehensive growth
icon lucide/brain-circuit
- label 2024
value 240
desc Expand ecosystem collaboration, aim for new highs
icon lucide/trophy
theme light
palette antv
```
## ⚙️ Configuration
Access settings via **Settings** → **Community plugins** → **Infographic**.
| Setting | Description | Default |
|---------|-------------|---------|
| **Auto render** | Automatically render in preview mode | `true` |
| **Theme** | Auto / Light / Dark | `auto` |
| **Error behavior** | show-code / show-error / hide | `show-code` |
| **Max width** | Maximum width (px) | `800` |
| **Max height** | Maximum height (px) | `600` |
### Toolbar Actions
Each rendered infographic shows a toolbar:
- **Copy** - Copy source code to clipboard
- **Export** - Save as SVG or PNG
- **PDF Export** - Compatible with Obsidian's built-in Export to PDF
## 🤖 Agent Skill
This plugin is also available as an **Agent Skill** for creating AntV Infographic visualizations in Obsidian.
### Skill Location
```
skills/obsidian-infographics/
├── SKILL.md # Skill definition and usage guide
└── reference/
└── GALLERY.md # Complete template catalog with examples
```
### Usage in Agents
When used as a skill, AI agents can generate AntV Infographic visualizations by outputting `infographic` code blocks in Obsidian markdown:
```infographic
infographic list-row-simple-horizontal-arrow
data
items
- label Step 1
desc Start
- label Step 2
desc In Progress
- label Step 3
desc Complete
```
### Available Templates (200+)
| Category | Templates |
| -------------- | -------------------------------------------------------------------------------------------------- |
| **Lists** | list-row-simple-horizontal-arrow, list-row-simple-horizontal, list-column, list-grid, list-pyramid |
| **Sequences** | sequence-horizontal, sequence-timeline, sequence-roadmap, sequence-steps |
| **Comparison** | compare-binary, compare-swot |
| **Hierarchy** | hierarchy-tree, hierarchy-structure |
| **Charts** | chart-bar, chart-column, chart-line, chart-pie |
| **Quadrant** | quadrant-simple, quadrant-quarter |
| **Relations** | relation-circle, relation-dagre |
See [Template Gallery](skills/obsidian-infographics/reference/GALLERY.md) for complete examples.
## 🛠️ Development
```bash
# Install dependencies
npm install
# Development build (watch mode)
npm run dev
# Production build
npm run build
# Lint
npm run lint
```
## 📄 License
Licensed under the Apache License, Version 2.0. See [LICENSE](LICENSE) for details.
Render [AntV Infographic](https://github.com/antvis/Infographic) visualizations directly in your Obsidian notes using fenced code blocks. ✨
## ✨ Features
- 🎨 **200+ Built-in Templates** - Process flows, timelines, hierarchies, charts, and more
- 📝 **Dual Syntax Support** - Use JSON configuration or AntV's declarative DSL
- 🖼️ **PDF Support** - Fully compatible with Obsidian's Export to PDF feature
- 🌓 **Theme Support** - Auto-detect or force light/dark mode
- 📐 **Responsive Design** - Automatic resize handling
- 🔄 **Live Reload** - Refresh all infographics with a single command
## 📦 Installation
### 🧪 Install via BRAT (Beta)
For beta/development versions, install using [BRAT](https://github.com/TfTHacker/obsidian42-brat):
1. Install [BRAT](https://github.com/TfTHacker/obsidian42-brat) from Community Plugins
2. Go to **Settings** → **BRAT** → **Add Beta Plugin**
3. Enter the repository URL:
```
https://github.com/shuuul/obsidian-infographic
```
4. BRAT will download and keep the plugin updated
5. Enable **Infographic** from Community Plugins
### Manual Installation
1. Download the latest release from [GitHub Releases](https://github.com/shuuul/obsidian-infographic/releases):
- `main.js`
- `manifest.json`
- `styles.css`
2. Create folder: `Vault/.obsidian/plugins/obsidian-infographic/`
3. Place the downloaded files in the folder
4. Reload Obsidian and enable the plugin
## 🚀 Usage
Create an infographic using a fenced code block with the `infographic` language:
### JSON Format
```infographic
{
"template": "list-row-simple-horizontal-arrow",
"data": {
"items": [
{ "label": "Step 1", "desc": "Start" },
{ "label": "Step 2", "desc": "In Progress" },
{ "label": "Step 3", "desc": "Complete" }
]
}
}
```
### DSL Format
```infographic
infographic list-row-simple-horizontal-arrow
data
items
- label Step 1
desc Start
- label Step 2
desc In Progress
- label Step 3
desc Complete
```
## 📋 Template Examples
### Timeline
```infographic
infographic sequence-timeline-rounded-rect-node
data
title Company Advantages List
desc Show core strengths and performance metrics across different dimensions
items
- label Brand Influence
value 85
desc Strong recognition and trust among target users
time 2021
icon mingcute/diamond-2-fill
illus creative-experiment
- label R&D Capability
value 90
desc Proprietary core systems with continuous innovation
time 2022
icon mingcute/code-fill
illus code-thinking
- label Market Growth
value 78
desc Rapid user base growth in the past year
time 2023
icon mingcute/wallet-4-line
illus business-analytics
- label Service Satisfaction
value 88
desc High ratings for overall service system
time 2020
icon mingcute/happy-line
illus feeling-happy
- label Data Assets
value 92
desc Complete user tagging and profiling system
time 2022
icon mingcute/user-4-line
illus mobile-photos
- label Innovation
value 83
desc New product launches exceed industry average
time 2023
icon mingcute/rocket-line
illus creativity
theme light
palette antv
```
### Hierarchy
```infographic
infographic hierarchy-structure
data
title System Layer Architecture
desc Show modules and functional groupings across different layers
items
- label Presentation Layer
children
- label Mini Program
- label APP
- label PAD
- label Desktop Client
- label WEB
- label Application Layer
children
- label Core Module
children
- label Function 1
- label Function 2
- label Function 3
- label Function 4
- label Function 5
- label Function 6
- label Base Module
children
- label Function 1
- label Function 2
- label Function 3
- label Function 4
- label Function 5
- label Function 6
- label Other Module
children
- label Function 1
- label Function 2
- label Function 3
- label Function 4
- label Function 5
- label Function 6
- label Platform Layer
children
- label Module 1
children
- label Function 1
- label Function 2
- label Function 3
- label Function 4
- label Module 2
children
- label Function 1
- label Function 2
- label Function 3
- label Function 4
- label Module 3
children
- label Function 1
- label Function 2
- label Function 3
- label Function 4
theme light
palette antv
```
### Comparison
```infographic
infographic compare-binary-horizontal-badge-card-fold
data
title Company Strengths vs Weaknesses
desc Present core strengths and areas for improvement in the market
items
- label Strengths
children
- label Strong R&D
desc Technology leadership with independent innovation
- label High Customer Retention
desc Over 60% repurchase rate, good reputation
- label Complete Service System
desc Fast after-sales response, high satisfaction
- label Weaknesses
children
- label Weak Brand Exposure
desc Insufficient marketing, awareness needs improvement
- label Limited Channel Coverage
desc Incomplete online channel layout
- label High Operating Costs
desc Labor and logistics costs above industry average
theme light
palette antv
```
### Chart
```infographic
infographic chart-bar-plain-text
data
title Annual Revenue Growth
desc Compare recent three years and current year targets (unit: 100M yuan)
items
- label 2021
value 120
desc Initial transformation, steady exploration
icon lucide/sprout
- label 2022
value 150
desc Platform optimization, significant efficiency gains
icon lucide/zap
- label 2023
value 190
desc Deep digital integration, comprehensive growth
icon lucide/brain-circuit
- label 2024
value 240
desc Expand ecosystem collaboration, aim for new highs
icon lucide/trophy
theme light
palette antv
```
## ⚙️ Configuration
Access settings via **Settings** → **Community plugins** → **Infographic**.
| Setting | Description | Default |
|---------|-------------|---------|
| **Auto render** | Automatically render in preview mode | `true` |
| **Theme** | Auto / Light / Dark | `auto` |
| **Error behavior** | show-code / show-error / hide | `show-code` |
| **Max width** | Maximum width (px) | `800` |
| **Max height** | Maximum height (px) | `600` |
### Toolbar Actions
Each rendered infographic shows a toolbar:
- **Copy** - Copy source code to clipboard
- **Export** - Save as SVG or PNG
- **PDF Export** - Compatible with Obsidian's built-in Export to PDF
## 🤖 Agent Skill
This plugin is also available as an **Agent Skill** for creating AntV Infographic visualizations in Obsidian.
### Skill Location
```
skills/obsidian-infographics/
├── SKILL.md # Skill definition and usage guide
└── reference/
└── GALLERY.md # Complete template catalog with examples
```
### Usage in Agents
When used as a skill, AI agents can generate AntV Infographic visualizations by outputting `infographic` code blocks in Obsidian markdown:
```infographic
infographic list-row-simple-horizontal-arrow
data
items
- label Step 1
desc Start
- label Step 2
desc In Progress
- label Step 3
desc Complete
```
### Available Templates (200+)
| Category | Templates |
| -------------- | -------------------------------------------------------------------------------------------------- |
| **Lists** | list-row-simple-horizontal-arrow, list-row-simple-horizontal, list-column, list-grid, list-pyramid |
| **Sequences** | sequence-horizontal, sequence-timeline, sequence-roadmap, sequence-steps |
| **Comparison** | compare-binary, compare-swot |
| **Hierarchy** | hierarchy-tree, hierarchy-structure |
| **Charts** | chart-bar, chart-column, chart-line, chart-pie |
| **Quadrant** | quadrant-simple, quadrant-quarter |
| **Relations** | relation-circle, relation-dagre |
See [Template Gallery](skills/obsidian-infographics/reference/GALLERY.md) for complete examples.
## 🛠️ Development
```bash
# Install dependencies
npm install
# Development build (watch mode)
npm run dev
# Production build
npm run build
# Lint
npm run lint
```
## 📄 License
Licensed under the Apache License, Version 2.0. See [LICENSE](LICENSE) for details.