One-minute walkthrough - every tab, function, and tool end-to-end. (MP4)
Tighter clip - open the modal, edit, pan / drag, insert, click the rendered chart to re-edit. (MP4)
## Why
Pgfplots is powerful but the syntax is fiddly and the feedback loop is "edit, recompile, squint". Easy TikZ is a visual editor with a live preview that renders the chart in your note directly - no TeX install needed for in-vault use, and the same model exports clean pgfplots when you want to publish.
## Install
**From inside Obsidian** (recommended)
1. Settings → Community plugins → **Browse**.
2. Search **Easy TikZ** and click **Install**, then **Enable**.
**Via BRAT** (early-access builds between releases)
1. Install the [BRAT](https://github.com/TfTHacker/obsidian42-brat) plugin.
2. BRAT settings → **Add Beta Plugin** → paste `Saiki77/easy-tikz`.
3. Enable **Easy TikZ** under Settings → Community plugins.
**Manual:** download `main.js`, `manifest.json`, `styles.css` from the [latest release](../../releases) into `/.obsidian/plugins/easy-tikz/`.
**Migrating from 2.x.** The plugin id changed to `easy-tikz` in 3.0. Rename `.obsidian/plugins/tikz_graph_helper/` to `.obsidian/plugins/easy-tikz/`, then re-enable. Settings carry over.
## Quick start
1. Click the function icon in the ribbon (or run *Easy TikZ: open* from the palette).
2. Type an expression on the **Functions** tab - `sin(x)`, `x^2 - 3*x`, `sin(sqrt(x^2 + y^2))` in 3D. The preview updates as you type.
3. **Insert into note**. The plugin emits an `easy-tikz` code block which it renders inline.
Open an existing chart by clicking it in your note - the modal re-opens with every setting filled in, and saving replaces the source block in place.
## Plot
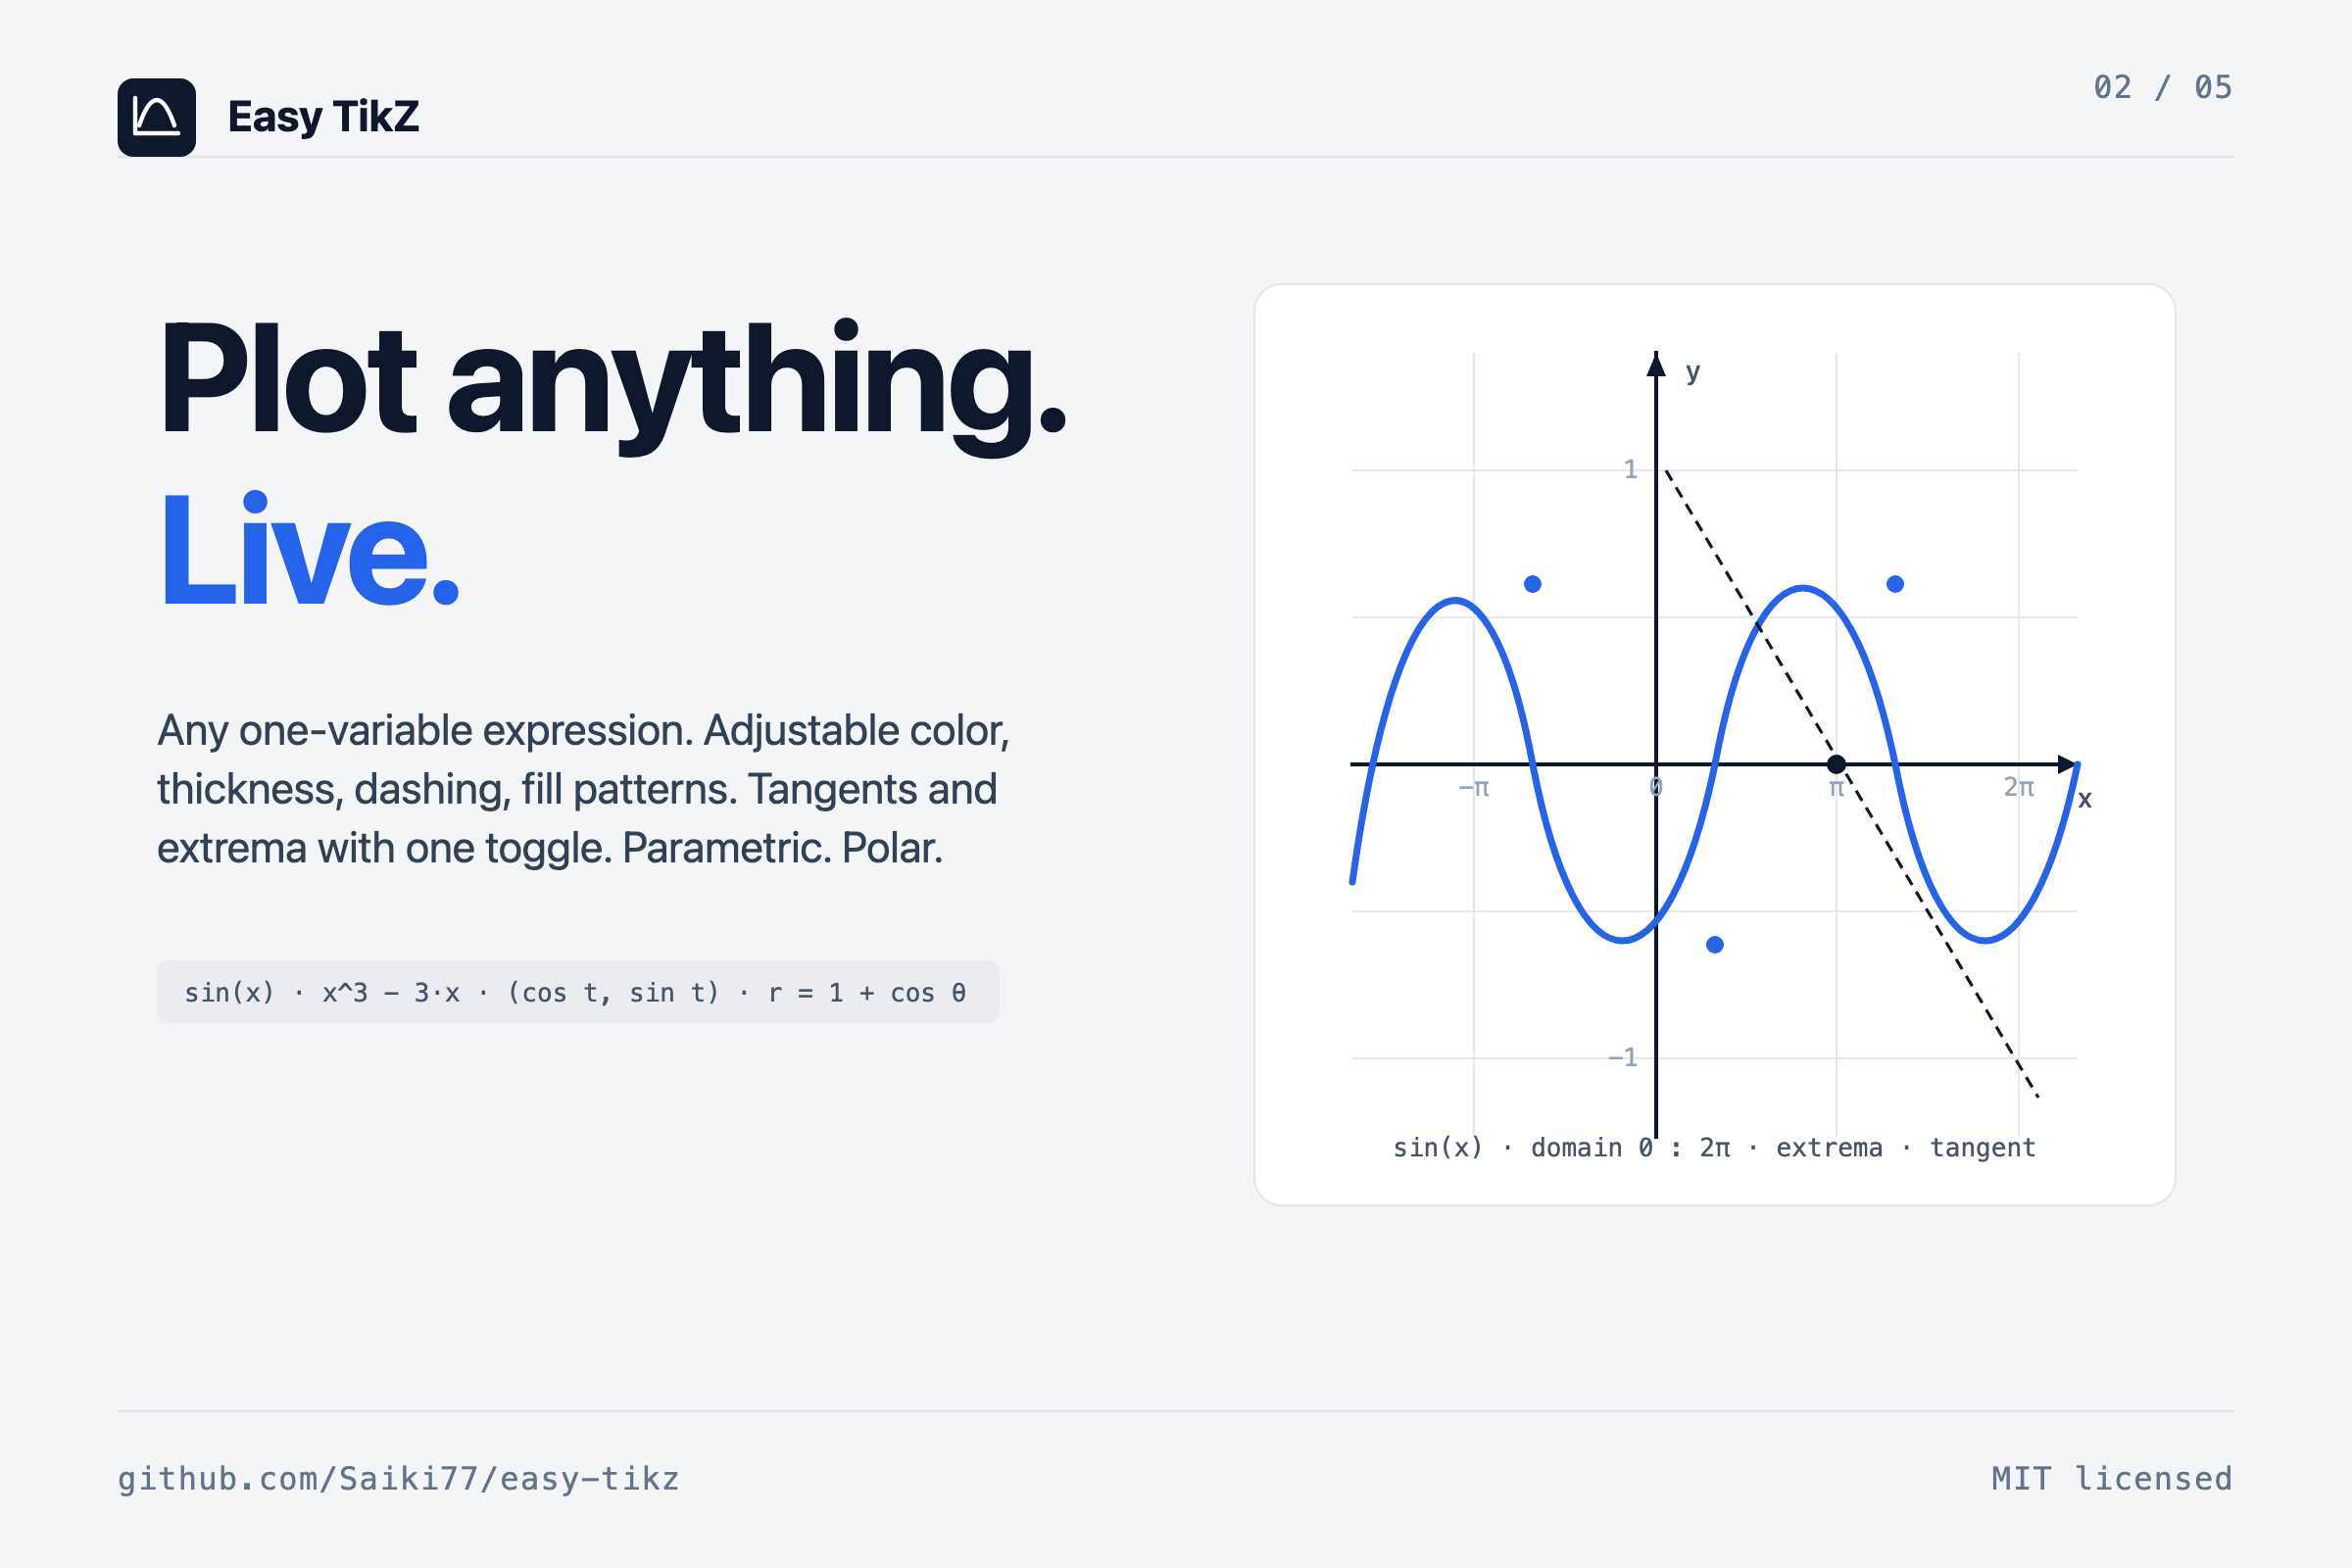
**2D.** Any one-variable expression. `^` is power, `Math.*` helpers are bare names, `PI` and `E` are constants. Toggle per-function: legend, fill (solid or pattern), dashed, tangent at a given x, automatic extrema markers, parametric (`x(t), y(t)`), or polar (`r(θ)`).
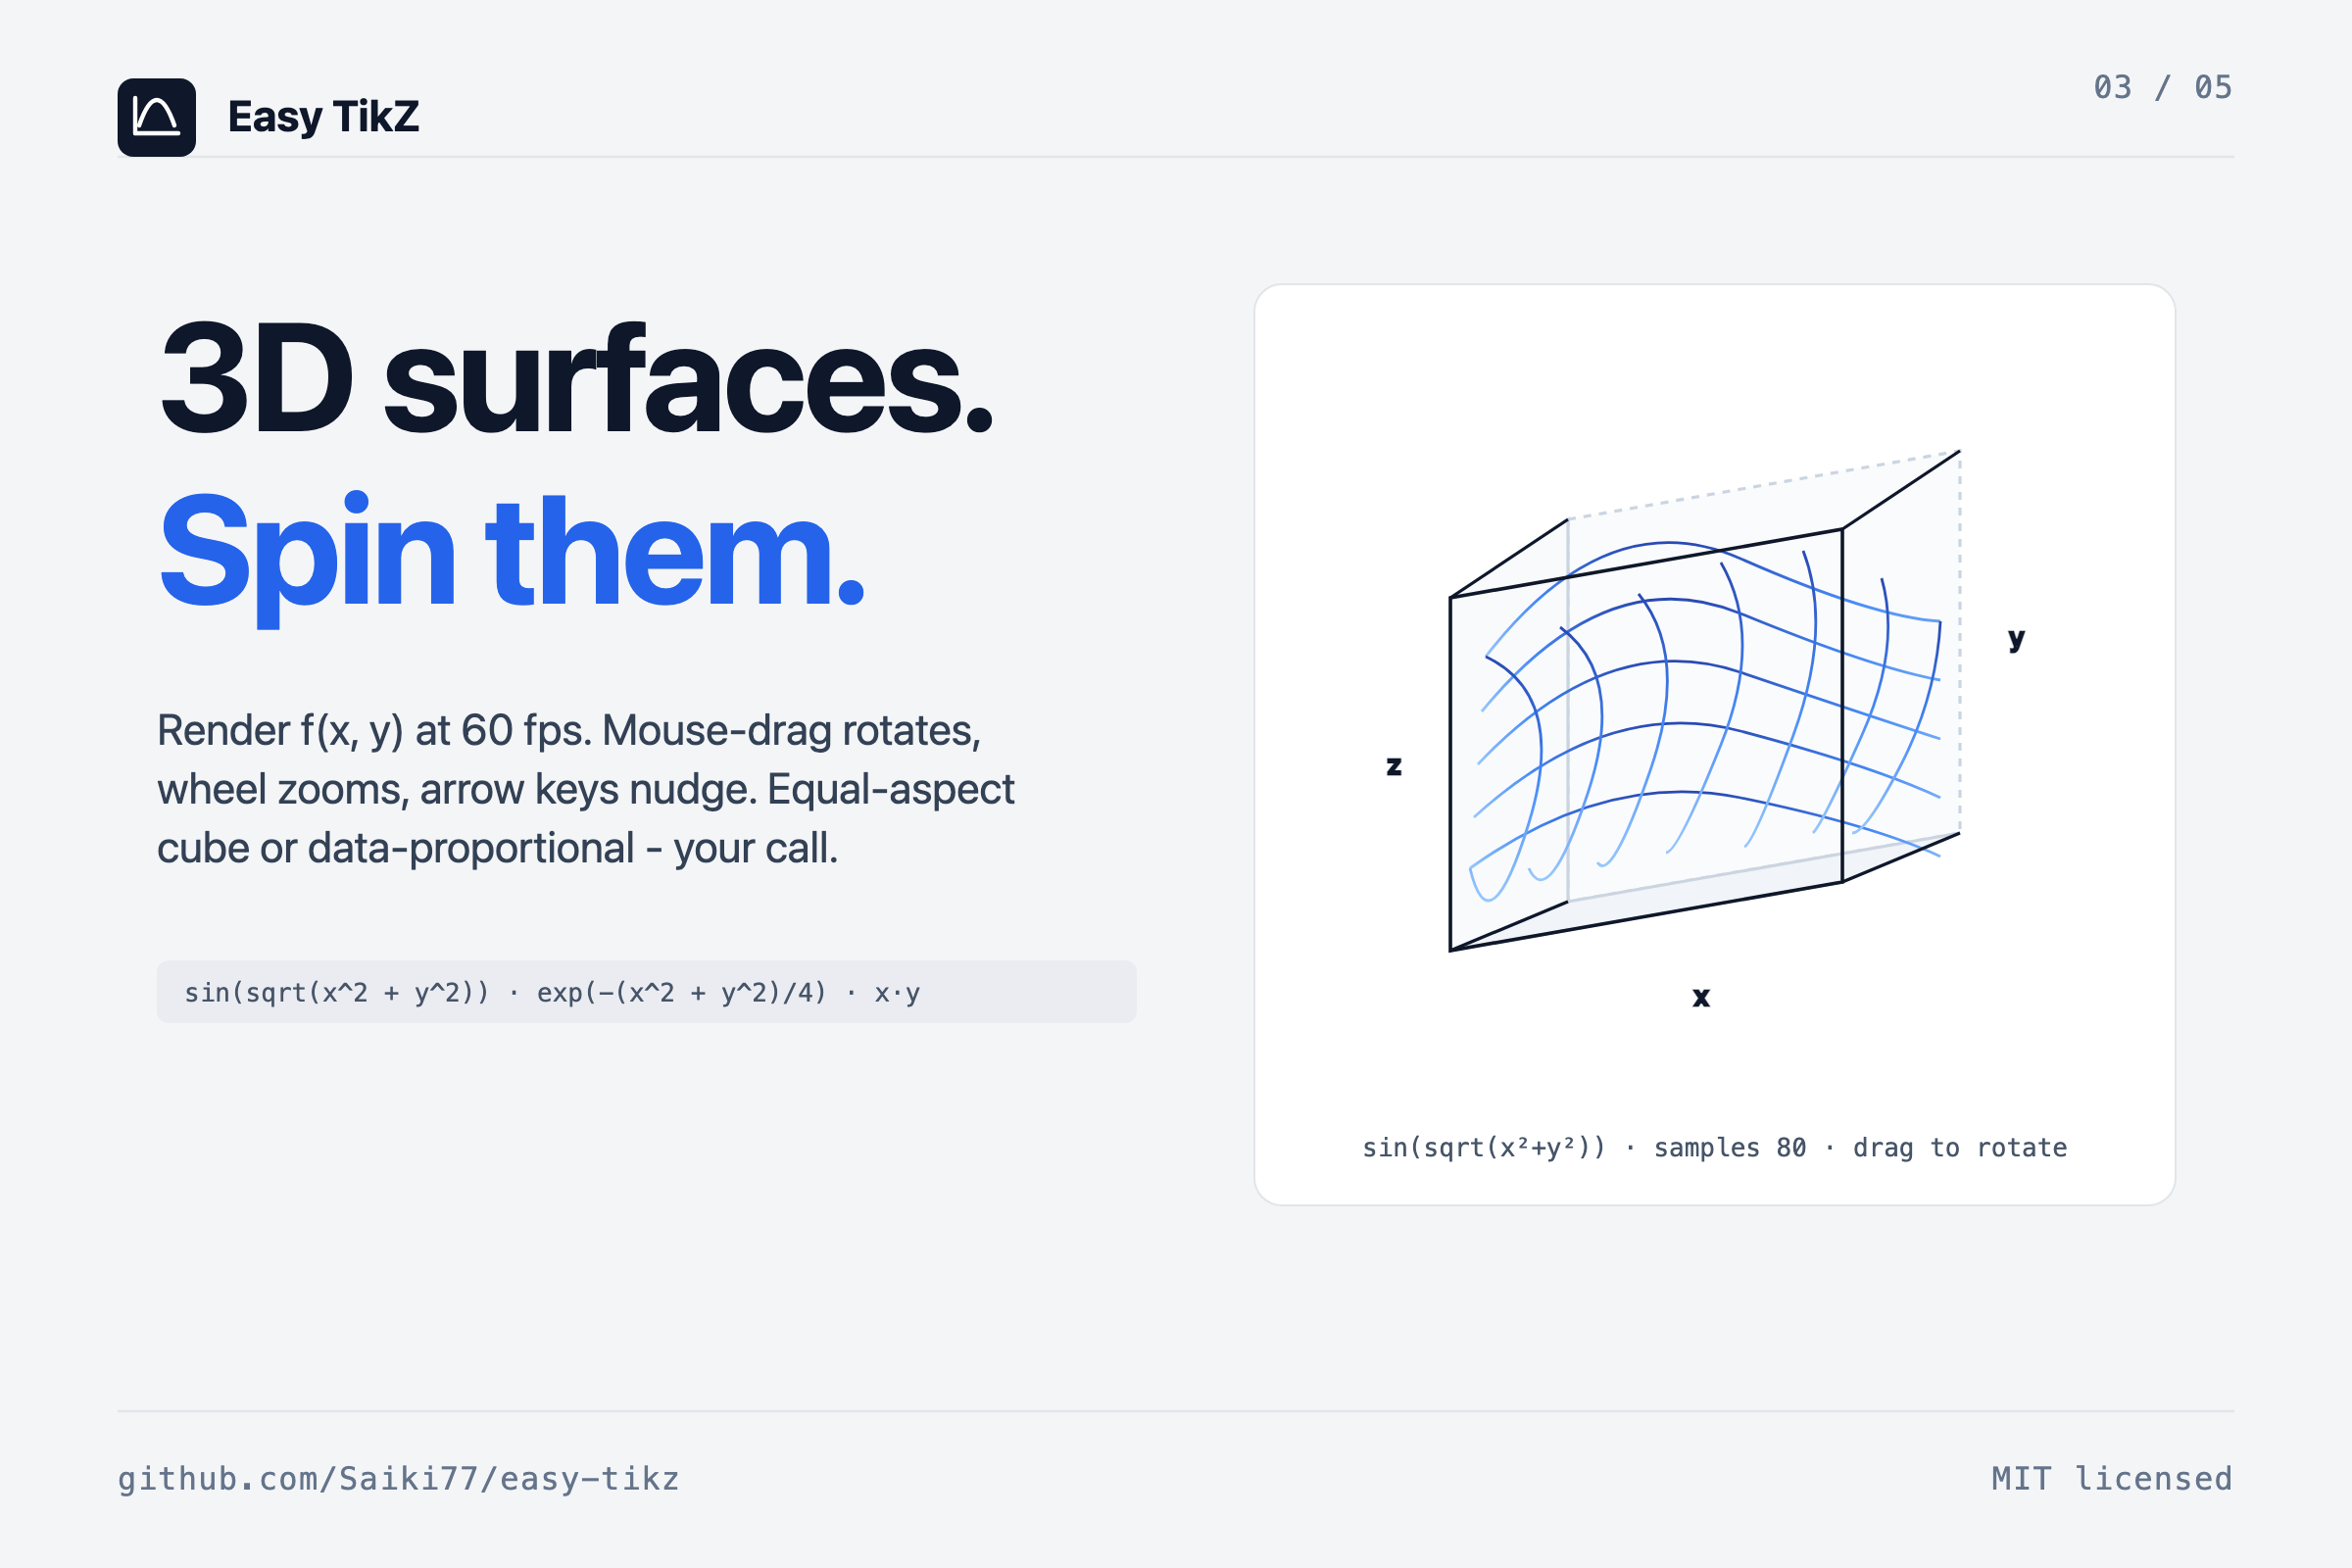
**3D.** Two-variable expressions over `(x, y)`. Wireframe or filled with adjustable opacity. Drag the preview to rotate, scroll to zoom, arrow keys for fine adjustments. Plugin setting controls the maximum samples-per-axis slider (default cap 80, raise up to 400 for export-quality surfaces).
```
sin(x) sin(x) * exp(-x/5) r = 1 + cos(θ)
x^3 - 3*x 1/(1 + x^2) (cos t, sin t)
sin(sqrt(x^2 + y^2)) exp(-(x^2 + y^2)/4) x*y
```
The Reference tab inside the modal lists everything supported with examples.
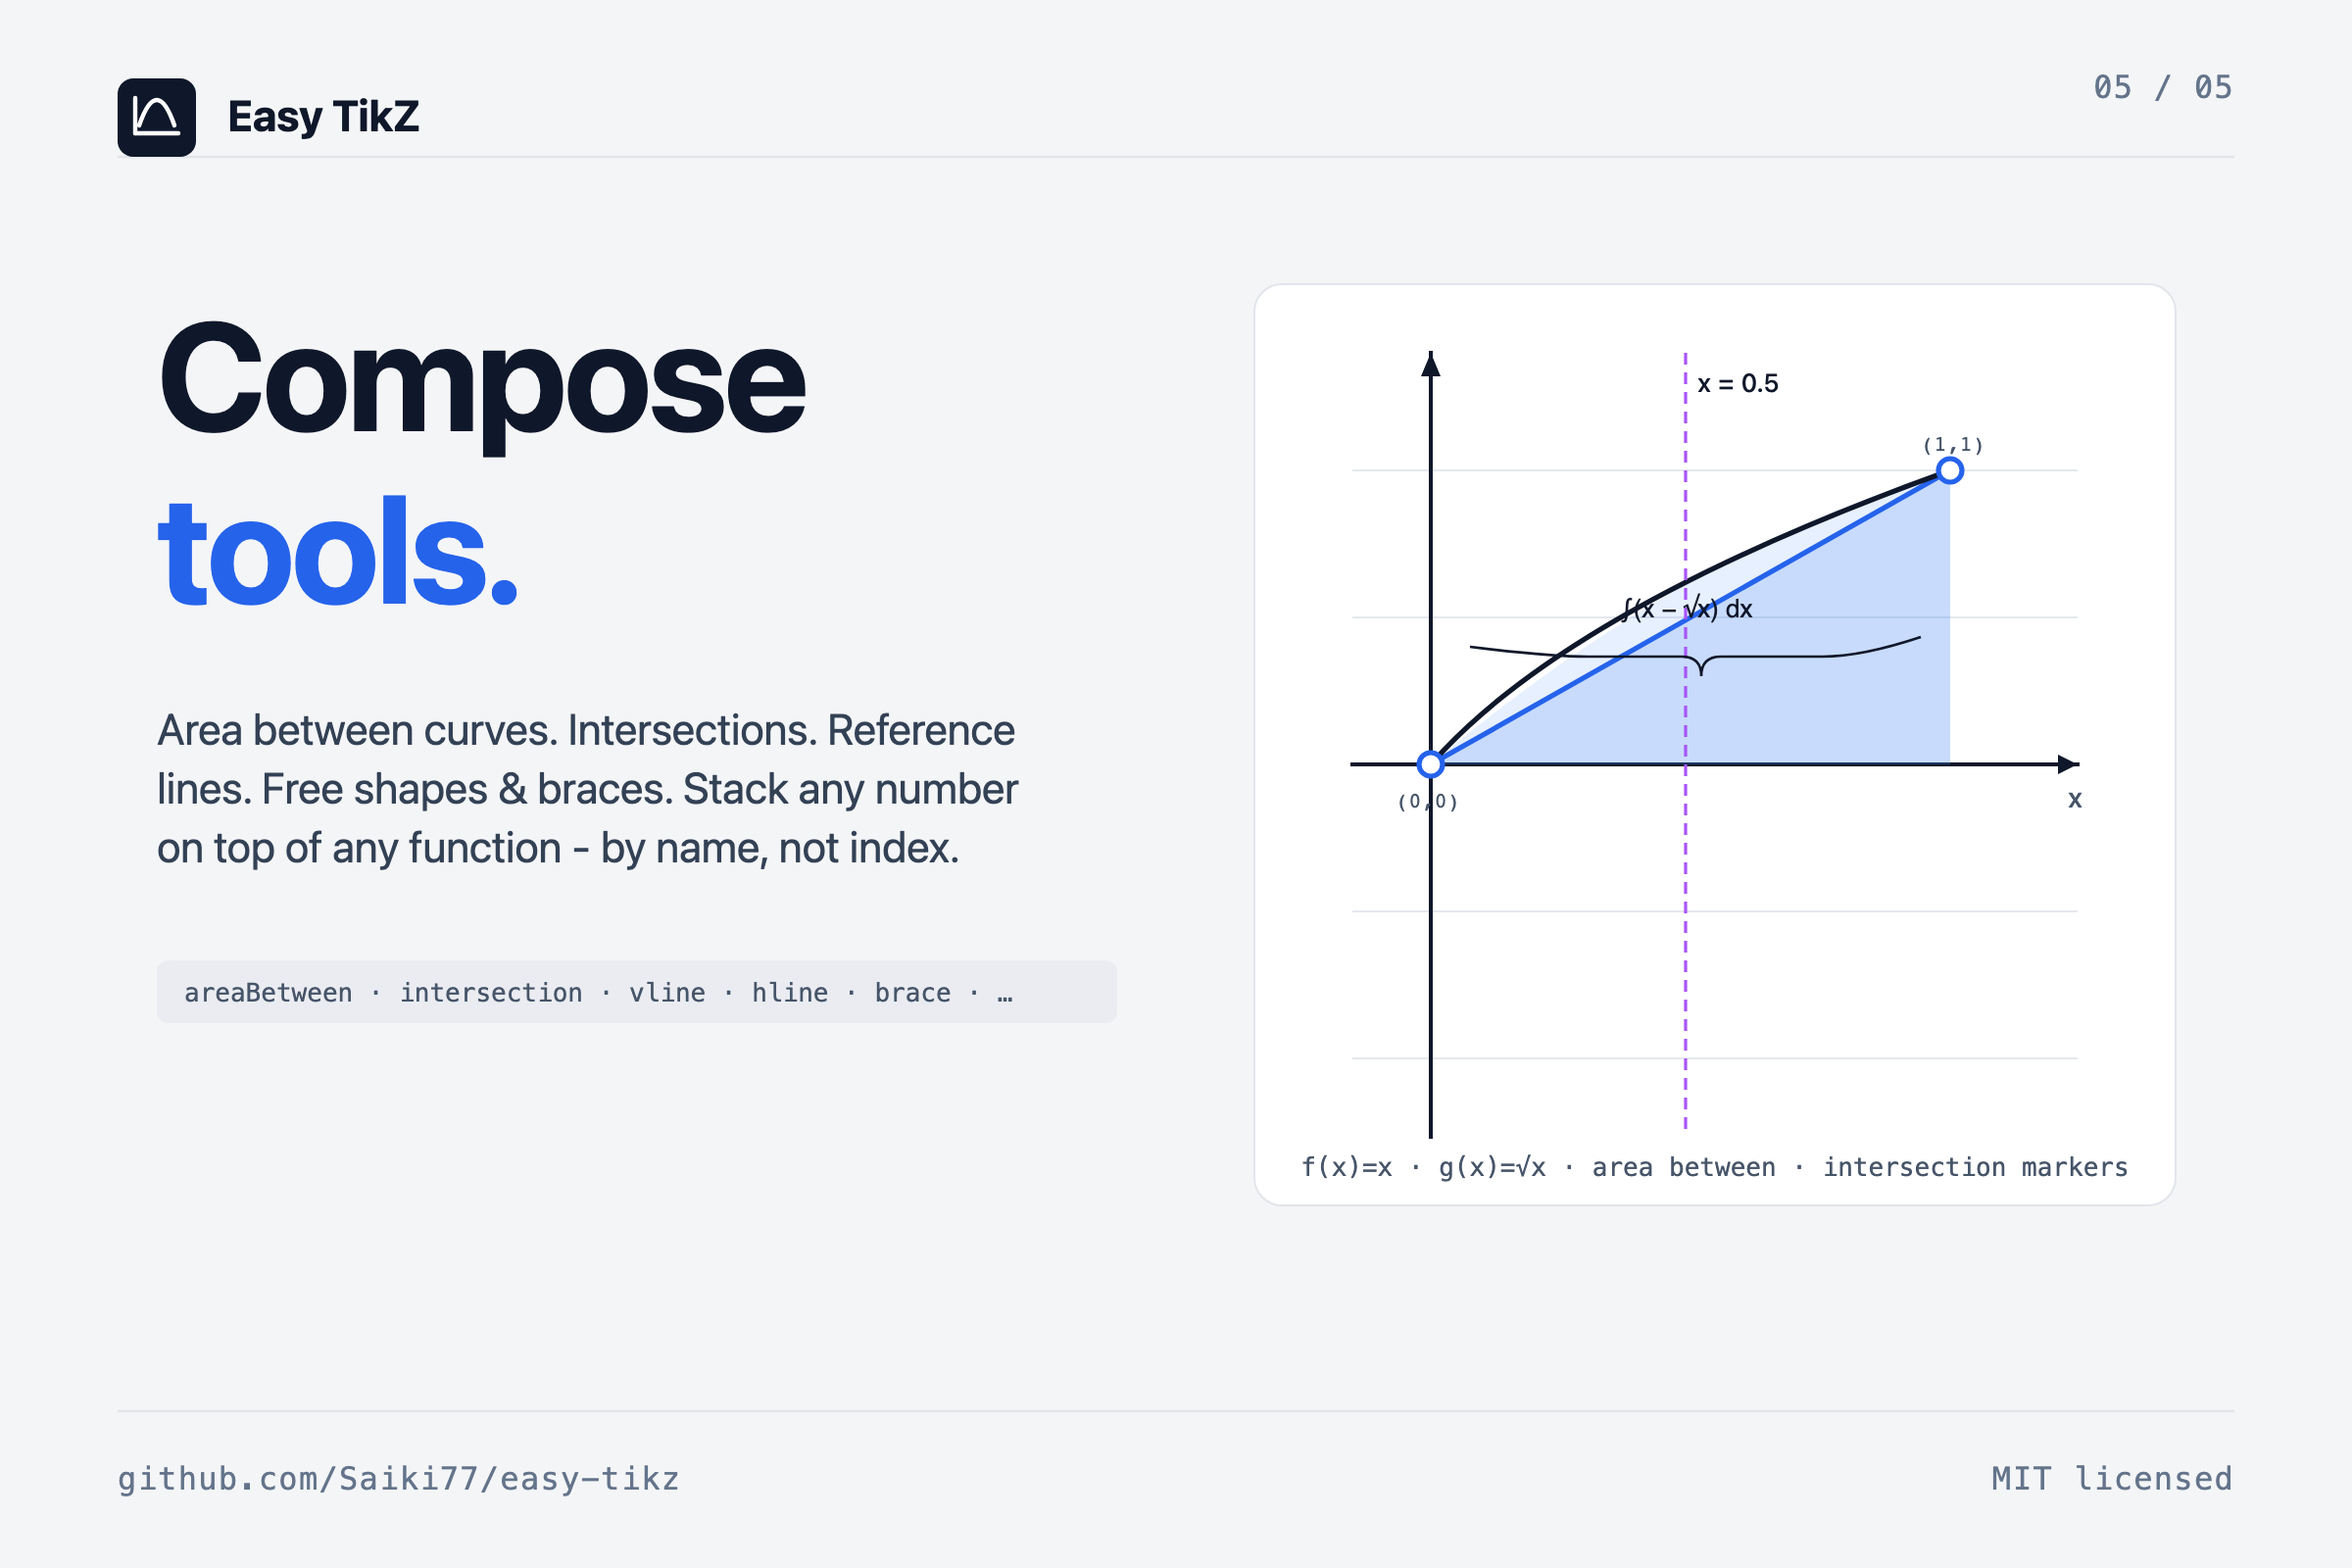
## Tools
On top of your functions you can stack composable tools - these render alongside the curves in the preview and emit native pgfplots in the export:
| Tool | What it draws |
| ---------------- | ------------------------------------------------------------------------------------------ |
| `areaBetween` | Filled region between two functions by **name** over an optional sub-domain. |
| `intersection` | Dots (and optional `(x, y)` labels) at every crossing of two functions on the visible range. |
| `verticalLine` | Vertical reference at `x = c`, optional label near the top. |
| `horizontalLine` | Horizontal reference at `y = c`, same knobs. |
| `rectangle` | Free rectangle with stroke + optional fill pattern. |
| `circle` | Free circle by center and radius. |
| `segment` | Line segment with arrow style `none / forward / backward / both`. |
| `brace` | Curly brace between two points with optional centered label. |
| `plane3D` | Slice plane at `axis = constant` in 3D, with chosen opacity. |
| `point3D` | Marker at `(x, y, z)` with optional label. |
| `segment3D` | 3D line between two points, optional arrow. |
Function references use a **Name** field on each function card (auto-populated as `f1, f2, …`, user-editable). That means "area between `f` and `g`" is stable across edits even if you reorder the functions.
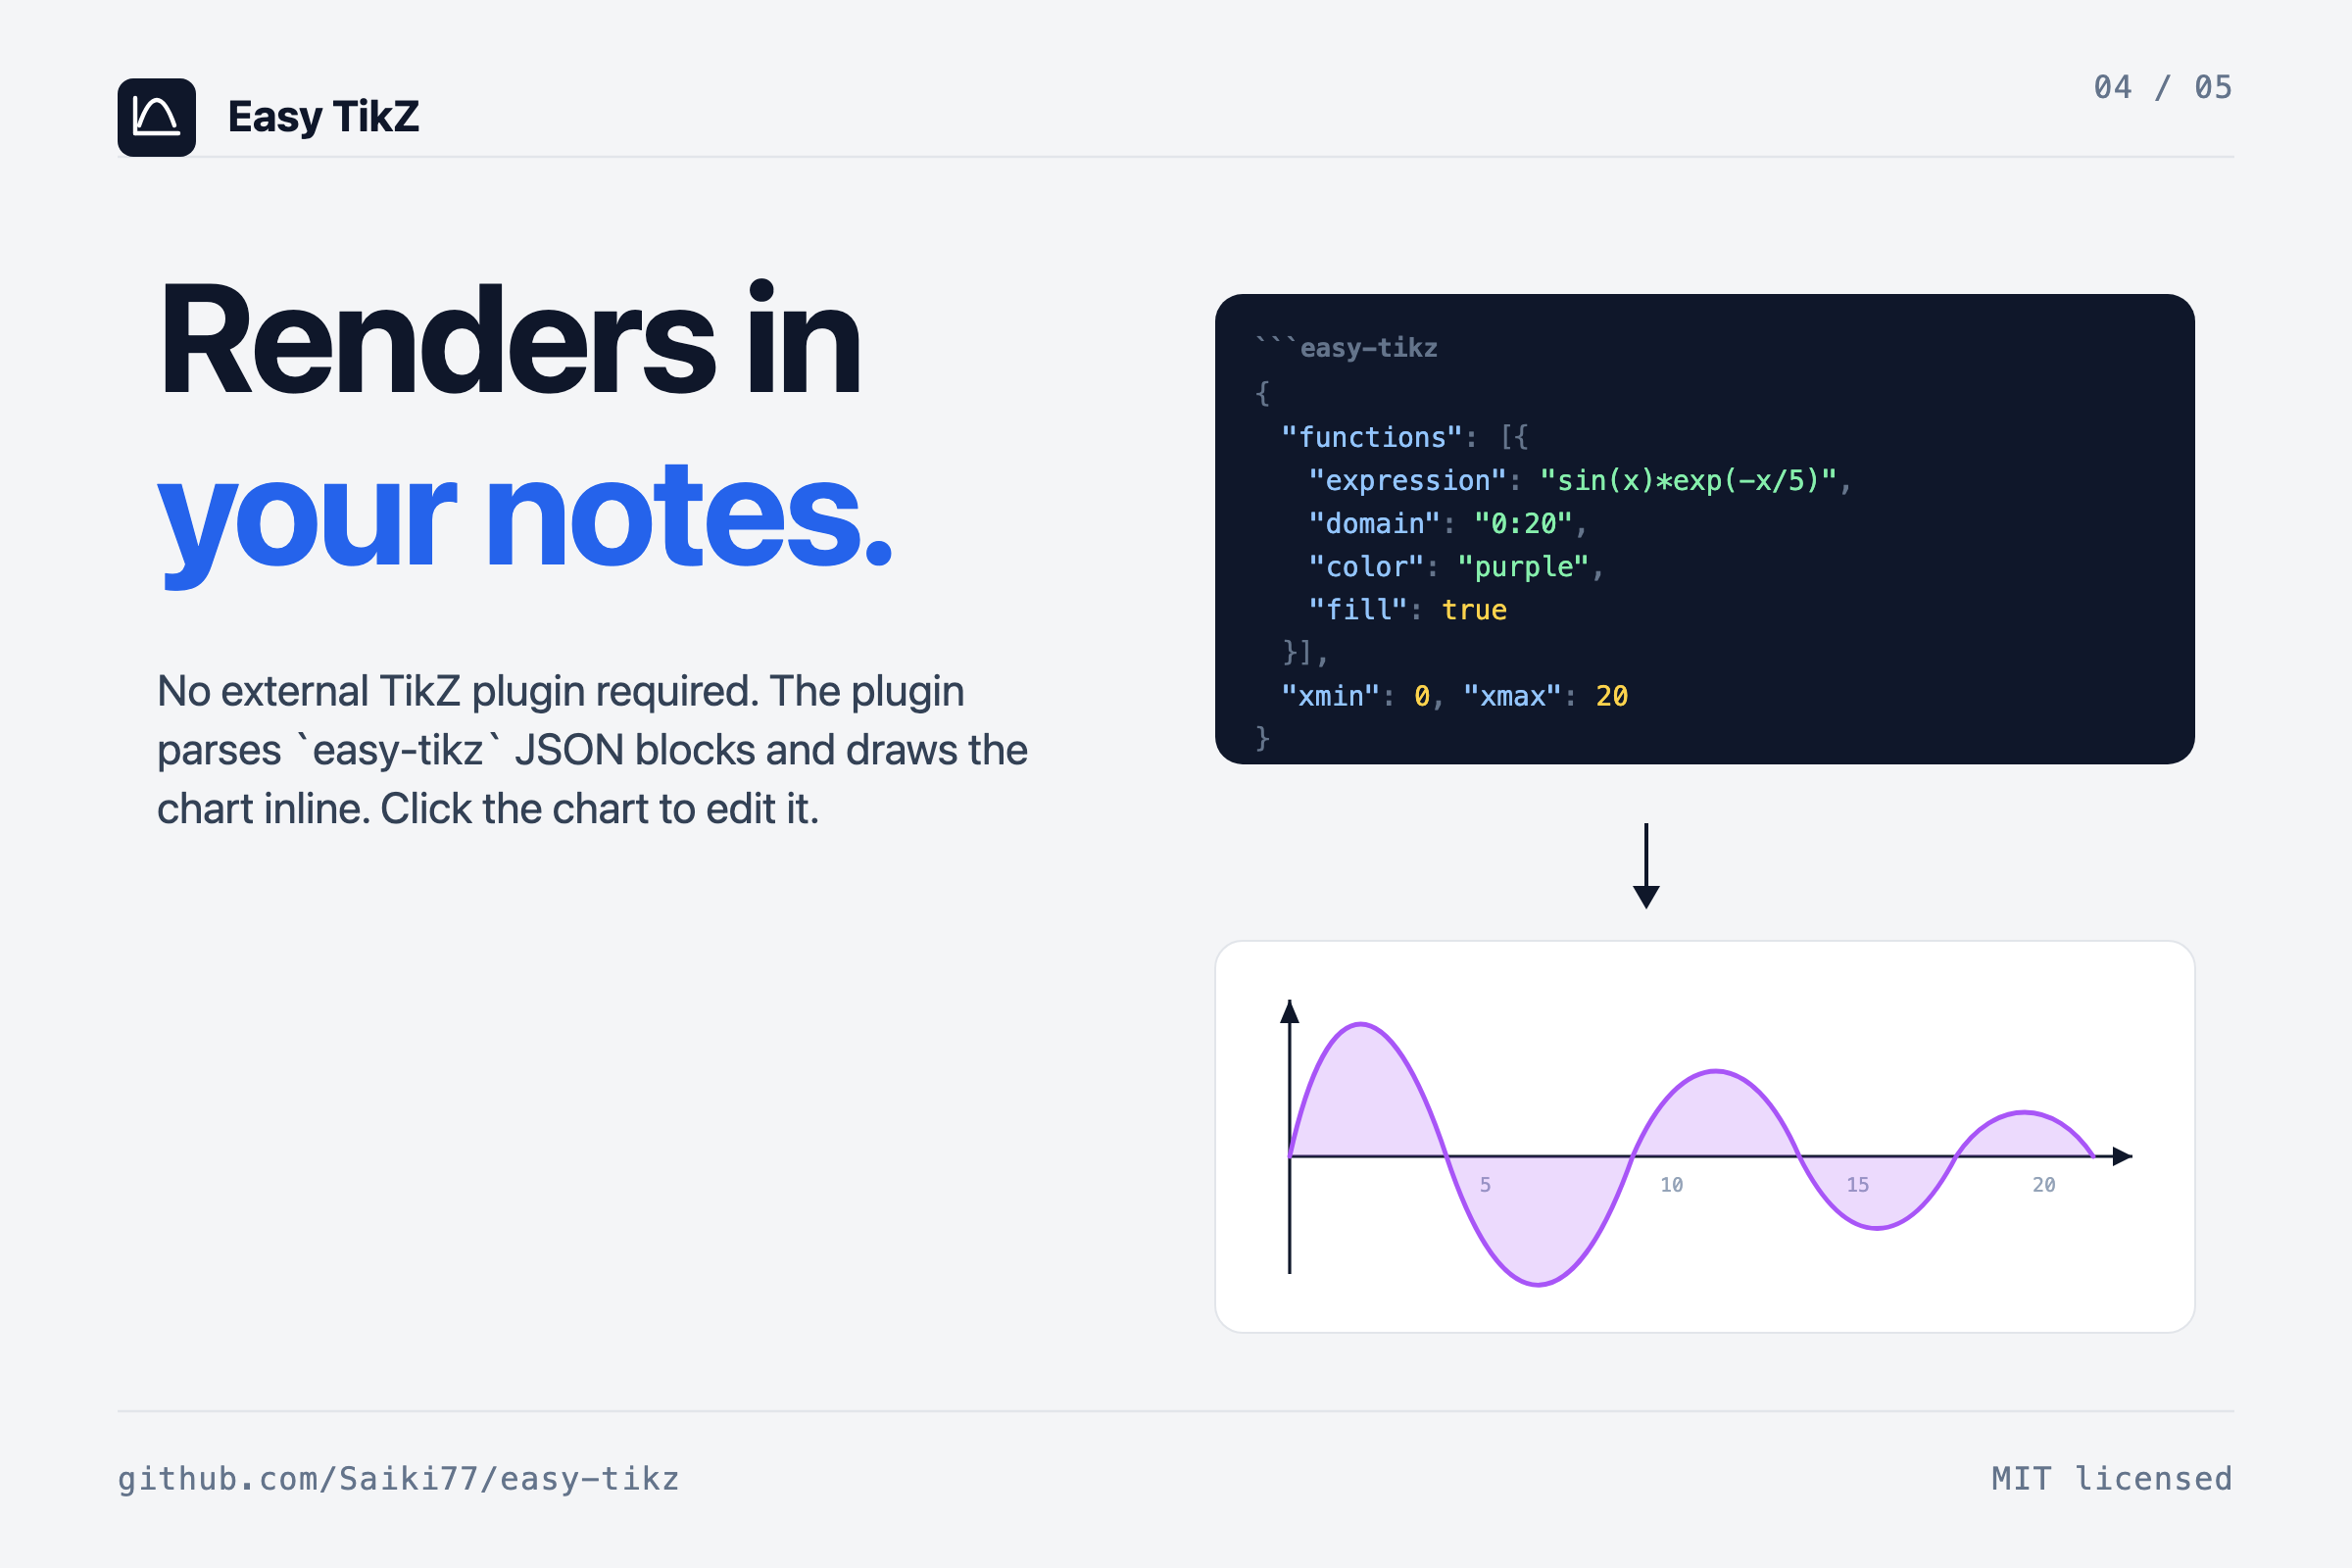
## Inline rendering in notes
The plugin registers an `easy-tikz` markdown code-block processor. **Insert into note** writes a JSON block; the same `SVGRenderer` / `SVG3DRenderer` that powers the modal preview renders the chart in your note. Click the rendered chart to re-open the modal pre-filled with every setting - change something, **Save changes**, the block in the source file is replaced in place.
Plugin setting **"Also render plain `tikz` blocks"** opts in to claim the `tikz` language tag as well; off by default to coexist peacefully with `obsidian-tikzjax` and similar.
## Export
`Copy TikZ code` produces standalone pgfplots that compiles with any TeX install - `\usepgfplotslibrary{fillbetween}` is injected automatically when an `areaBetween` tool is in use, the polar code path emits `axis equal`, `axis equal image` lights up when **Box aspect** is set to *Equal*. The inline render and the exported TikZ share one in-memory model, so what you see in the modal is what pgfplots draws - and the modal's `Copy SVG` and `Copy PNG` buttons each serialize the live scene with theme colours already resolved.
## Plugin settings
Settings → Community plugins → **Easy TikZ**:
- **Invert vertical drag in 3D.** Trackball convention by default (drag down tilts the scene up); flip for direct manipulation (camera follows finger).
- **Max 3D samples per axis.** Upper bound of the per-surface Samples slider. Default 80; can go up to 400 for export-quality meshes.
- **Also render plain `tikz` blocks.** Off by default; on if you want one tag for everything (conflicts with obsidian-tikzjax).
- **2D pan sensitivity.** Default 1.0 (direct: 1 mouse pixel = 1 chart pixel). 0.1–2.0.
## Live rendering, briefly
The preview is drawn in-process by a small custom pipeline - no shell-out, no LaTeX compile, no image round-trip - which is what lets the camera follow the cursor without lag. A typical 3D surface (samples=40, 1,600 quads) sits at ~60 fps; the slider's upper end (samples=120, 14,400 quads) settles above 30 fps. Sampled surface data is cached per-surface, keyed by expression + domain + sample count + z-range, so a pure camera change (rotation, zoom) re-projects from the cache without re-evaluating the function. Expression compilation is cached (LRU, 128 entries) so the 500 samples of a 2D curve compile their expression once per render, not once per sample.
## Permissions
- **Clipboard:** writes TikZ code / SVG / PNG on the *Copy …* buttons. No reads.
- **Active note:** inserts an `easy-tikz` block on **Insert into note**, replaces an existing block when saving from click-to-edit.
- **Network:** none.
- **Telemetry:** none.
- **Math evaluation:** user expressions are compiled with `Function` and evaluated in-renderer to draw the preview. Nothing is persisted or transmitted.
## Development
```bash
npm install
npm run dev # watch mode
npm run build # production build
```
```
src/
modal.ts # main modal UI + click-to-edit lifecycle
renderer.ts # 2D SVG renderer (functions + tools)
renderer3d.ts # 3D SVG / canvas renderer
settings.ts # state, serialisation, TikZ code generation
math.ts # expression evaluation, extrema, intersections
colors.ts # shared palette
templates.ts # built-in function templates + plugin data shape
util.ts # tick formatting, latex stripping
styles.css # all UI styling
types.ts # shared interfaces and the Tool union
```
## License
[MIT](LICENSE.md).