 |
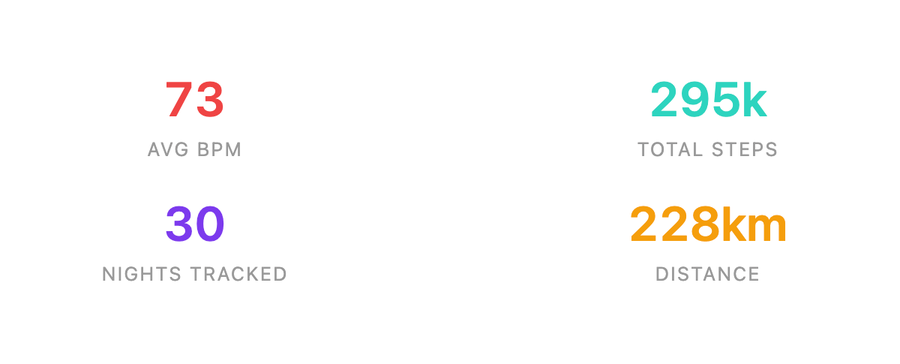
intro-stats
HTML summary card — totals, averages, and highlights for the selected dataset. Extra arguments: none. |
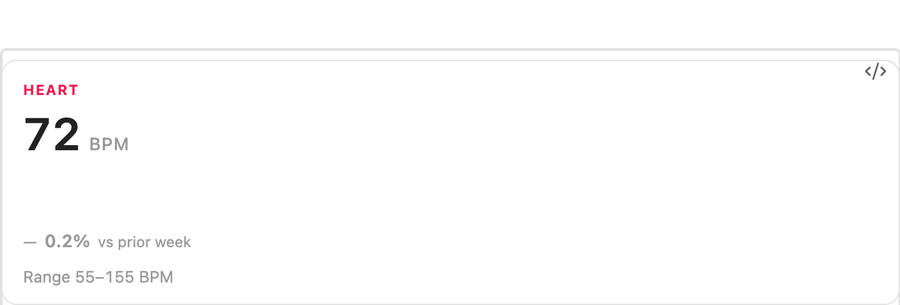 |
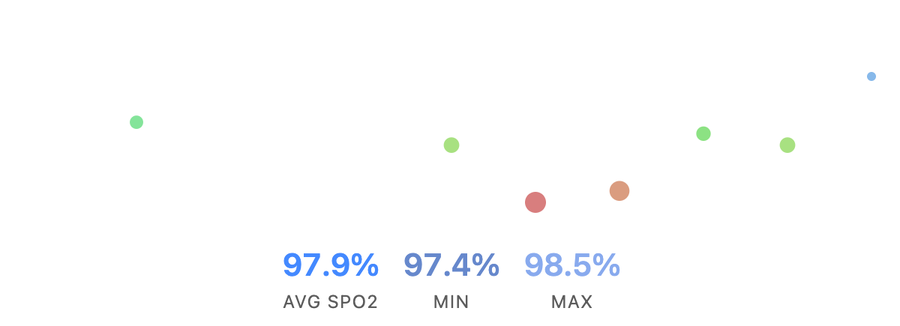
summary-card
Apple-style headline card with large KPI, sparkline, range, and comparison delta. Extra arguments: metric, compareWindow. |
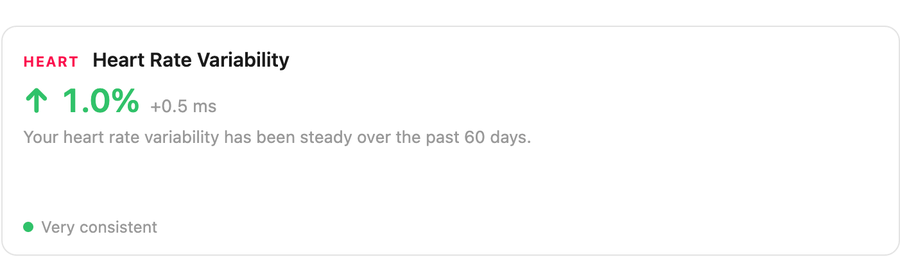 |
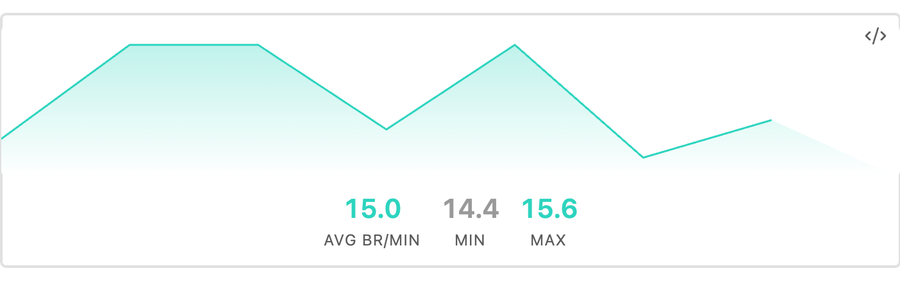
trend-tile
Apple Health Trends-style HTML card with direction arrow, percent delta, narrative, and two-period sparkline. Extra arguments: metric, currentWindow, priorWindow. |
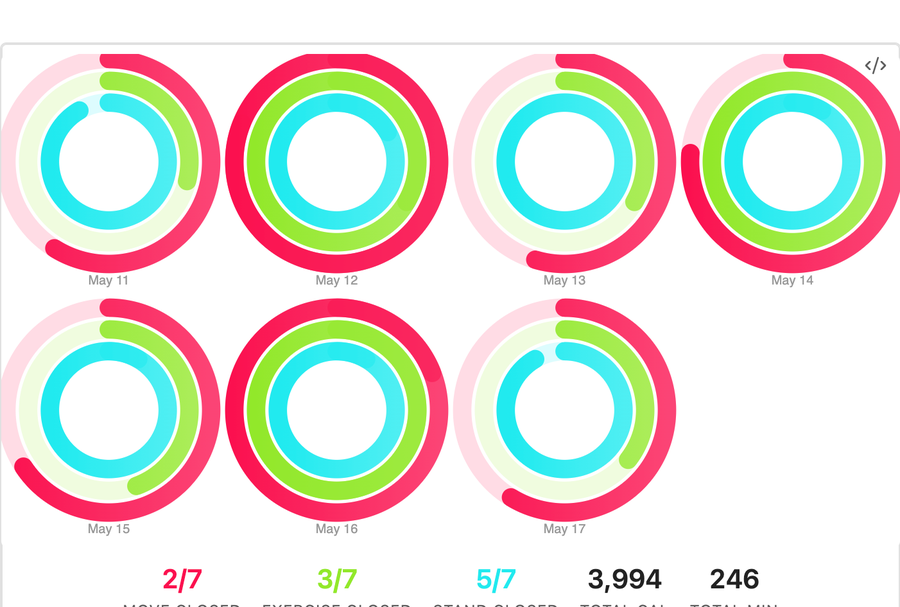 |
activity-rings
Apple's Move / Exercise / Stand rings; single-day large ring set or multi-day small multiples. Extra arguments: moveGoal, exerciseGoal, standGoal. |
 |
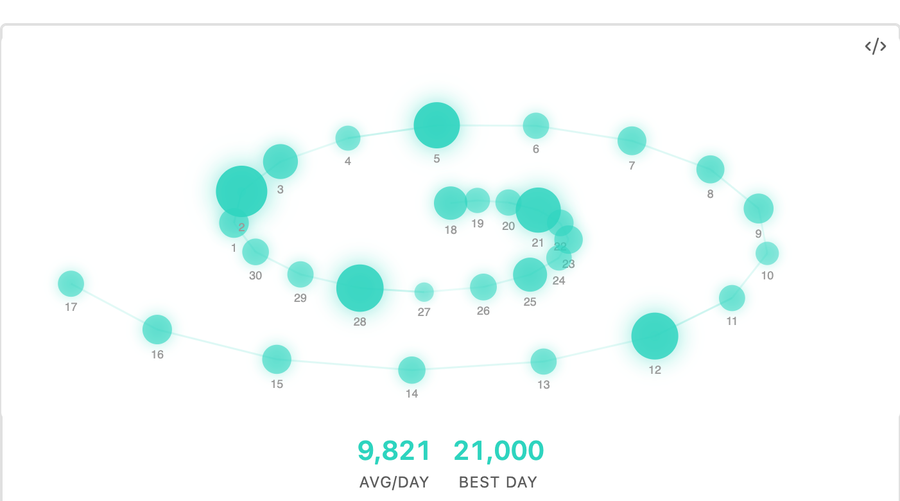
vitals-rings
Health.md radial activity/vitals rings: steps, calories, and heart-rate context per day. Extra arguments: none. |
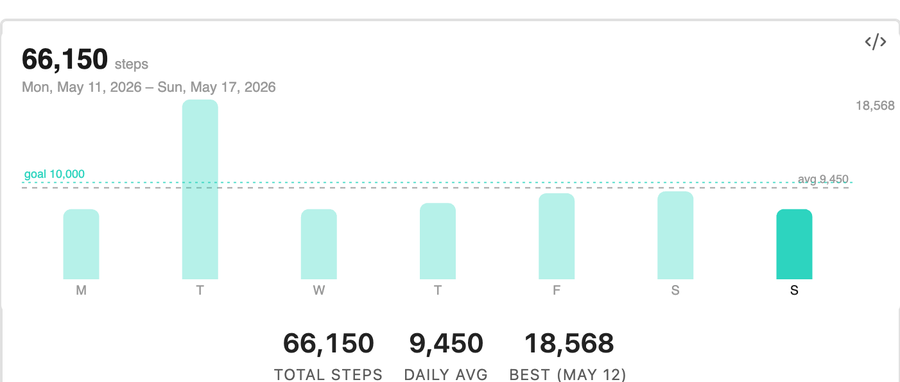 |
bar-chart
Apple-style vertical bars with latest day highlight, optional goal line, and optional average line. Extra arguments: metric, goal, showAverage. |
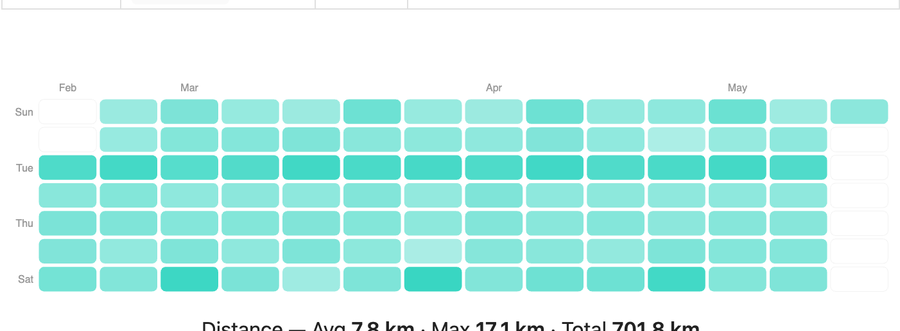 |
activity-heatmap
GitHub-style activity calendar shaded by daily steps, calories, or distance. Extra arguments: metric. |
 |
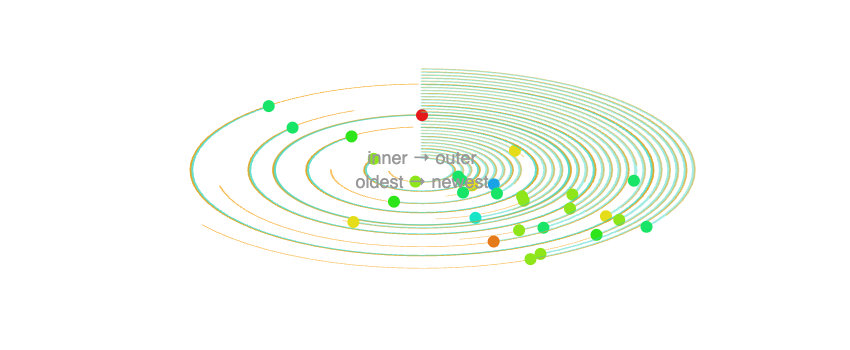
step-spiral
Daily step counts arranged on a spiral, with older days near the center and newer days spiraling outward. Extra arguments: none. |
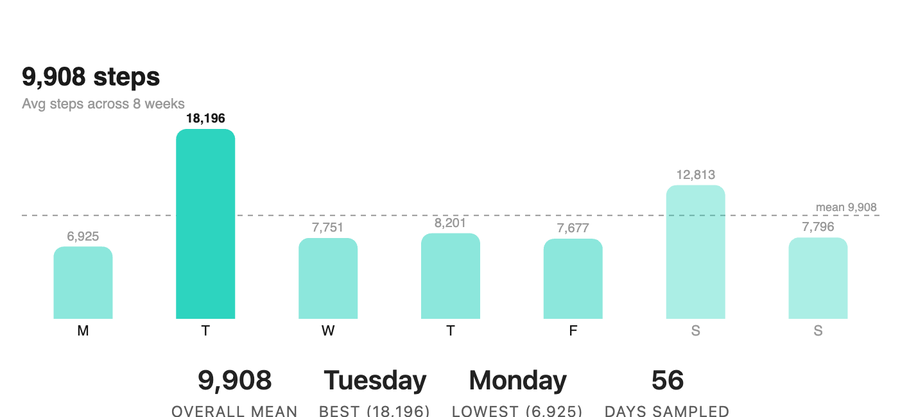 |
weekday-average
Seven bars showing a metric's average by weekday with an overall-mean line. Extra arguments: metric, weekStart. |
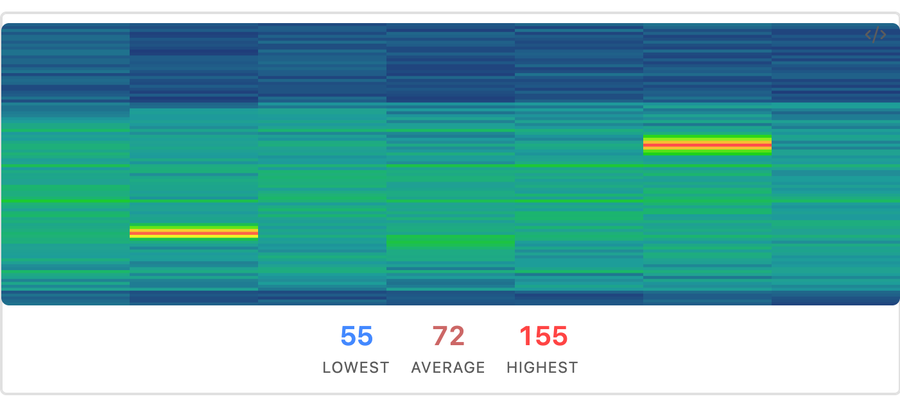 |
heart-terrain
Heart-rate samples plotted as daily terrain / ridgeline rows over time. Extra arguments: none. |
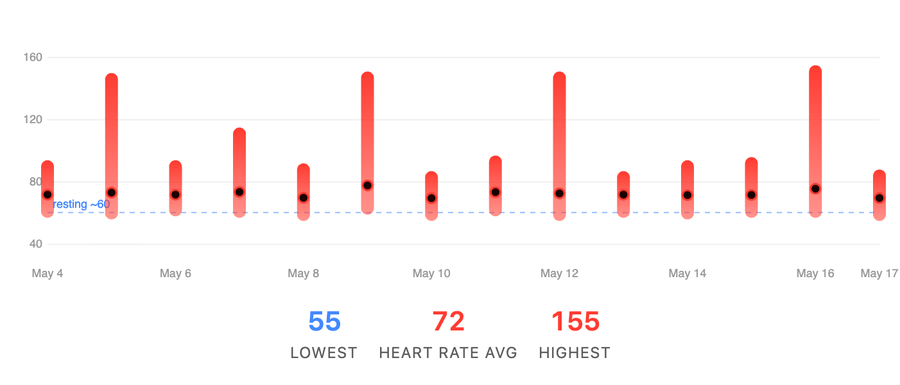 |
heart-range
Per-day min-to-max heart-rate capsule with an average dot and optional resting-HR reference line. Extra arguments: metric. |
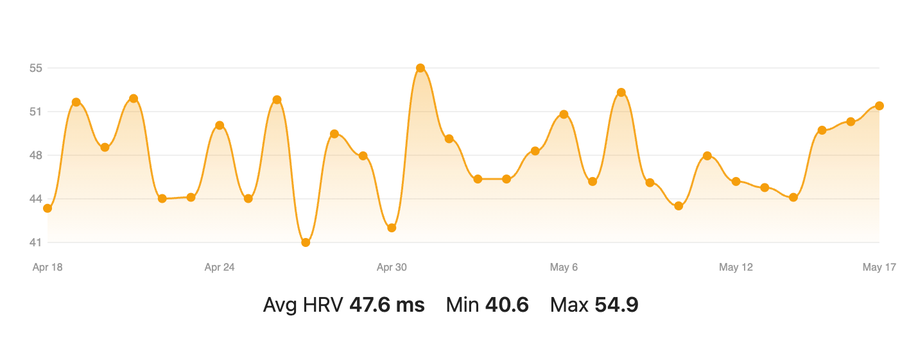 |
hrv-trend
HRV trend line from daily HRV or HRV samples. Extra arguments: none. |
 |
oxygen-river
Blood oxygen samples as a flowing band with summary stats. Extra arguments: none. |
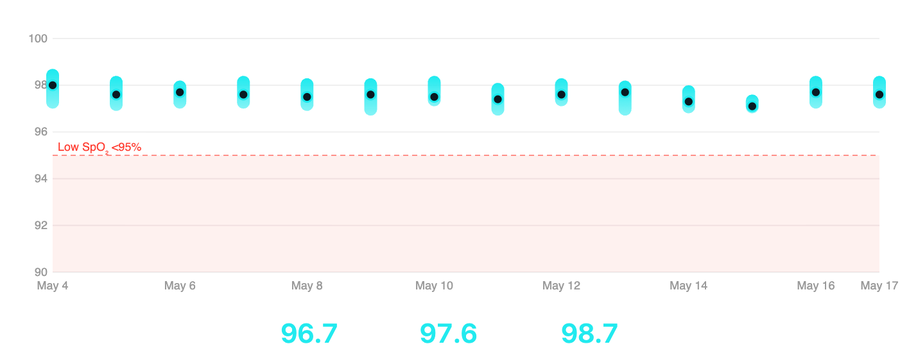 |
oxygen-range
Daily SpO₂ or respiratory min/max capsule with warning-zone shading. Extra arguments: metric. |
 |
breathing-wave
Respiratory-rate samples as a wave. Extra arguments: none. |
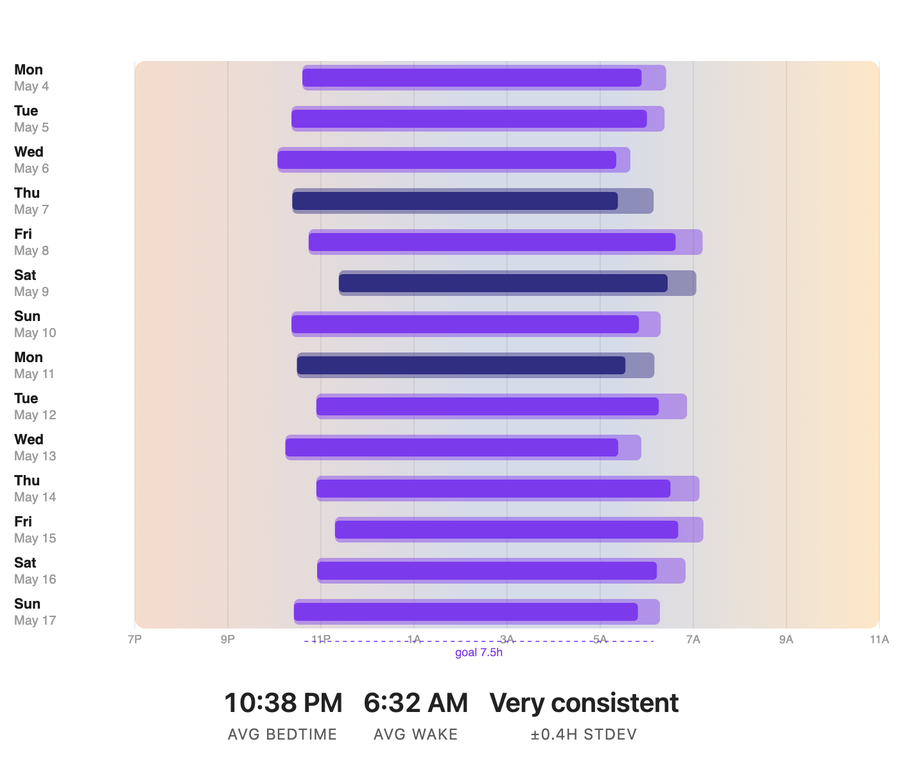 |
sleep-schedule
Horizontal bedtime-to-wake bars against a sunset→night→sunrise backdrop. Requires bedtime/wake timing or stage timestamps; 24-hour and 12-hour times are supported. Extra arguments: sleepGoal, windowStart, windowEnd. |
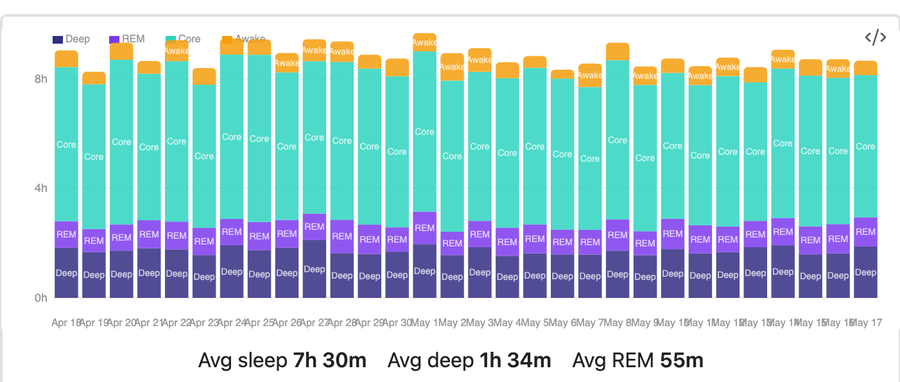 |
sleep-quality-bars
Stacked nightly bars for deep, core, REM, and awake time. Extra arguments: none. |
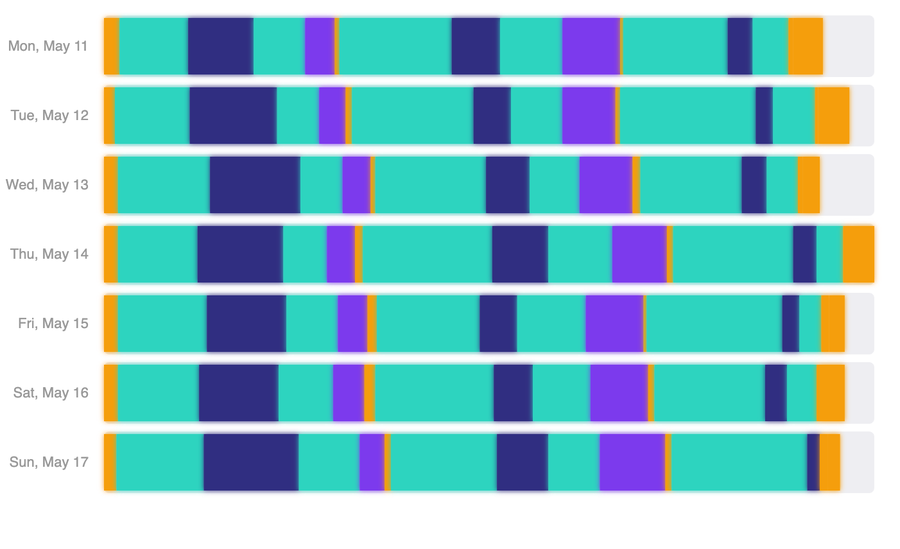 |
sleep-architecture
Linear timeline of sleep stages with depth bands. Extra arguments: none. |
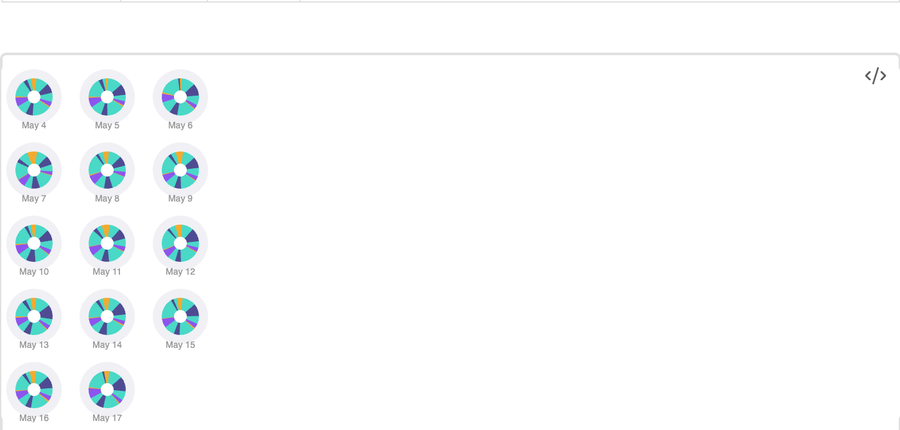 |
sleep-polar
Polar clock view of sleep stages per night. Extra arguments: none. |
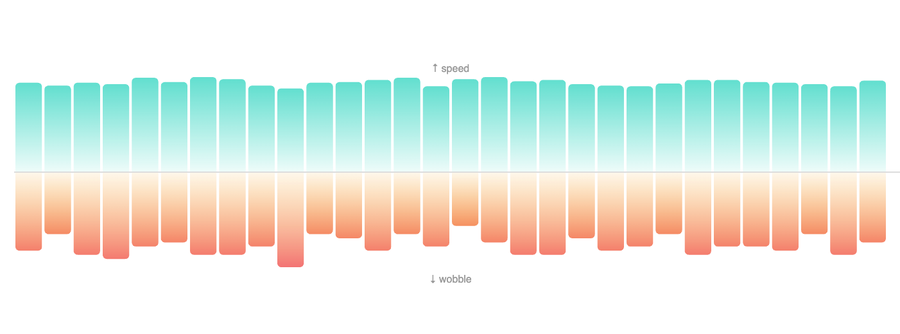 |
walking-symmetry
Walking speed and asymmetry / gait metrics. Extra arguments: none. |
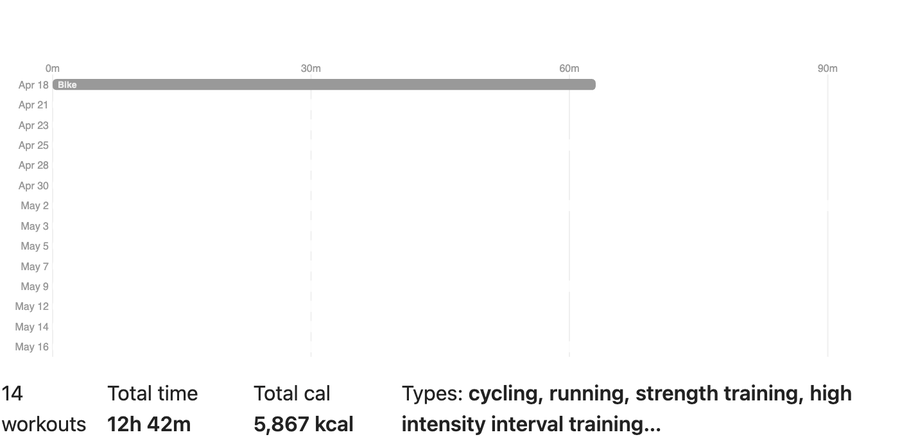 |
workout-log
Workout timeline with duration bars and workout-type colors. Extra arguments: none. |
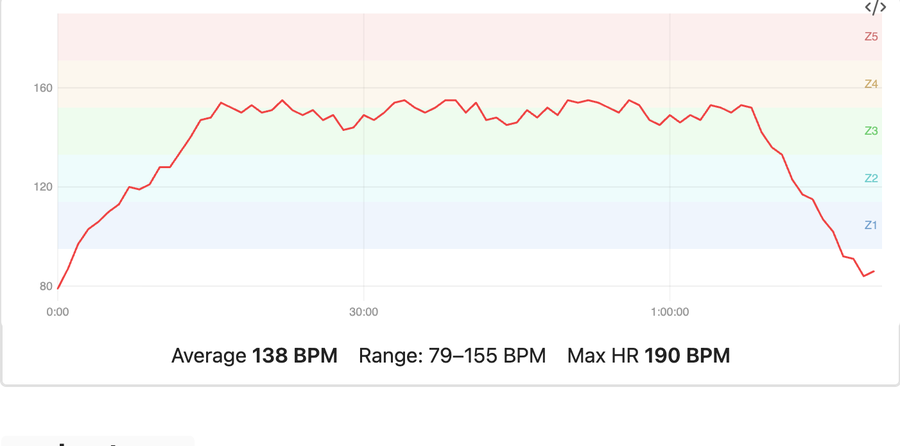 |
workout-heart-rate
Heart-rate time series and optional zone bands for one workout. Falls back to daily samples in the workout window, then to a min/avg/max summary chart. Extra arguments: date, workout, maxHeartRate. |
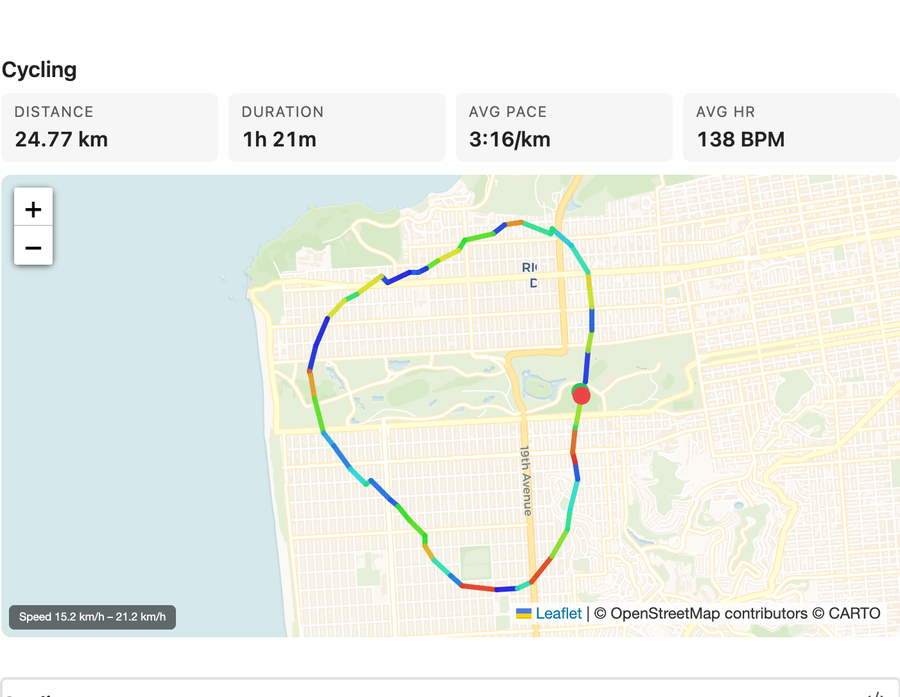 |
workout-map
GPS route map for one outdoor workout, colored by speed or heart rate. Extra arguments: date, workout, colorBy. |
All canvas chart types support hover tooltips. Click behavior is configurable: keep the default click-to-pin tooltip behavior, open the source health data file for a point, or open the matching Daily Note. JSON and CSV source files open in a built-in Health.md read-only viewer inside Obsidian, so source navigation does not launch your OS default editor. Aggregate canvas regions that cover multiple dates, such as `weekday-average` bars, navigate to the latest matching date in the rendered range. The `intro-stats`, `summary-card`, `trend-tile`, and `workout-map` types are HTML/SVG/Leaflet renderers (no canvas tooltip layer) for sharper typography and interactive map rendering.
### Bundled examples
Starter dashboards live in the `examples/` folder — copy any of them into your vault to see the code blocks render:
- `examples/visualization-reference.md` — comprehensive reference for every visualization, including supported arguments, defaults, metric values, and copy/paste blocks.
- `examples/apple-dashboard.md` — full Apple Health-style summary using the Apple-inspired visualizations (summary cards, activity rings, heart range, bar chart, sleep schedule, weekday average, oxygen range, trend tiles).
- `examples/daily-dashboard.md` — single-day overview for daily notes.
- `examples/weekly-overview.md` — rolling week-at-a-glance across activity, heart, respiratory, sleep, mobility, and workouts.
- `examples/sleep-analysis.md` — sleep-focused drill-down.
This repo also ships deterministic mock data in `examples/Health/` (one JSON file per day from 2025-11-19 through 2026-12-31). When the default `Health/` folder is empty or missing, the plugin falls back to this bundled dataset so cloned examples render immediately. You can also set **Settings → Health.md Visualizations → Data folder** to `examples/Health` explicitly.
## Embedding charts in notes
A code block requires a `type` and accepts any of the optional config keys below. Each entry is a `key: value` line. Lines starting with `#` are comments.
````markdown
```health-viz
type: vitals-rings
width: 600
height: 400
```
````
### Common config keys
| Key | Type | Default | Description |
| --- | --- | --- | --- |
| `type` | string | *(required)* | Visualization type — see the gallery above. |
| `width` | number | from settings | Canvas width in pixels (chart shrinks to container width). |
| `height` | number | from settings | Canvas height in pixels. |
| `from` | date or datetime | — | Start of the data window (inclusive). |
| `to` | date or datetime | — | End of the data window (inclusive). |
| `last` | number | — | Number of calendar days back to include. |
| `clickAction` | `pin`, `source`, `daily` | from settings | Optional per-chart override for data point clicks: pin tooltip, open source data file, or open matching Daily Note. |
Individual visualization types may accept additional keys — see `examples/visualization-reference.md` for every supported renderer-specific argument, default, and accepted value.
## Filtering by date or date+time
Every visualization can be scoped to a custom window using `from`, `to`, and/or `last`. The filter is applied uniformly across all chart types — no need to learn per-chart syntax.
### Just a date
`from` and `to` accept ISO calendar dates:
````markdown
```health-viz
type: step-spiral
from: 2026-01-01
to: 2026-03-31
```
````
Open-ended ranges are fine too:
````markdown
```health-viz
type: oxygen-river
from: 2026-04-01
```
````
### Last N days
`last: N` is a rolling window of `N` calendar days ending today. `last: 1` is just today; `last: 30` is today plus the previous 29 days.
````markdown
```health-viz
type: heart-terrain
last: 30
```
````
Combine `last` with `to` to anchor the window on a specific day instead of today:
````markdown
```health-viz
type: vitals-rings
to: 2026-03-31
last: 7
```
````
This shows the 7-day window ending **March 31, 2026**.
### Sub-day windows with datetimes
`from` and `to` also accept ISO datetimes — `YYYY-MM-DDTHH:MM` or `YYYY-MM-DDTHH:MM:SS`, with an optional `Z` or `±HH:MM` timezone suffix. When you provide a time component, the plugin slices sub-day samples on the boundary days so the chart only shows data inside the requested window.
````markdown
```health-viz
type: heart-terrain
from: 2026-04-09T06:00:00
to: 2026-04-09T12:00:00
```
````
The chart above renders only morning heart rate samples for April 9, 2026.
A multi-day window with precise endpoints:
````markdown
```health-viz
type: oxygen-river
from: 2026-04-01T22:00:00
to: 2026-04-08T07:00:00
```
````
Includes April 1 from 10 PM onward, the full days April 2 through 7, and April 8 up to 7 AM.
You can mix datetimes with `last`:
````markdown
```health-viz
type: breathing-wave
to: 2026-04-09T12:00:00
last: 7
```
````
A 7-day calendar window ending April 9, with samples after noon on April 9 trimmed.
Explicit timezones work too:
````markdown
```health-viz
type: sleep-architecture
from: 2026-04-09T22:00:00-07:00
to: 2026-04-10T08:00:00-07:00
```
````
If you omit the timezone, the time is interpreted in your local timezone (matching JavaScript's `Date.parse` semantics).
### Day-level aggregates are recomputed
When a sub-day window slices a boundary day's samples, day-level fields like `averageHeartRate`, `bloodOxygenAvg`, `totalDuration`, `deepSleep`, `bedtime`, etc. are **automatically recomputed from the sliced samples**. This means the stats shown alongside your charts (in `intro-stats`, sleep tooltips, vitals rings, and other panels) reflect the requested time window — not the full day.
The fields that are recomputed:
- **Heart**: `averageHeartRate`, `heartRateMin`, `heartRateMax`, `hrv`
- **Vitals**: `bloodOxygenAvg`/`Min`/`Max` (and the legacy `bloodOxygenPercent`), `respiratoryRateAvg`/`Min`/`Max` (and legacy `respiratoryRate`)
- **Sleep**: `totalDuration` (deep + REM + core), `deepSleep`, `remSleep`, `coreSleep`, `awakeTime`, `bedtime`, `wakeTime`, plus all formatted-string variants
- **Workouts**: filtered by `startTime`
A guard ensures aggregates aren't clobbered for days that were parsed from daily summaries without per-sample data — those days pass through unchanged.
#### Limitation: activity totals
Apple Health exports `activity.steps`, `activity.activeCalories`, `activity.exerciseMinutes`, `activity.flightsClimbed`, `activity.standHours`, `activity.basalEnergyBurned`, and `mobility.*` as **daily totals only**, with no underlying sub-day samples. There is no truthful way to slice those numbers for a partial day, so they pass through unchanged on boundary days. This affects the step ring in `vitals-rings`, the totals in `step-spiral`, and any walking/mobility metrics on a boundary day. Heart-rate–derived fields inside the same charts *are* recomputed correctly.
### Validation
The plugin validates the date range up front and renders an inline error if something is off:
- `Invalid "from" value: ... Use YYYY-MM-DD or YYYY-MM-DDTHH:MM[:SS].`
- `Invalid "last": ... Use a positive number of days.`
- `"from" (...) is after "to" (...).`
- `No health data in range (...).` — when the window is valid but produces an empty result.
## Daily-note tip
Add a `health-viz` block to your daily-note template (Templates or Templater plugin) and have a moving "last N days" view automatically appear in every new daily note:
````markdown
```health-viz
type: heart-terrain
last: 7
```
````
Because `last` is anchored on today by default, each new daily note shows the most recent 7 days at the moment you open it. The plugin's data cache invalidates whenever files in your data folder change, so the chart always reflects the latest export.
## Data format reference
The plugin auto-detects the data format from the file extension. Each file should represent **one day** of health data and live inside your configured data folder.
- `.json` — A `HealthDay` object (see `src/types.ts` for the full shape).
- `.csv` — Section headers (`Heart`, `Sleep`, `Vitals`, `Activity`, `Mobility`, …) followed by `Metric,Value` rows. See `src/parsers/csv-parser.ts`.
- `.md` — A markdown file with YAML frontmatter that uses fields like `heart_rate_avg`, `sleep_deep`, `steps`, etc. **Plain markdown without frontmatter is not parsed.** See `src/parsers/markdown-parser.ts`. This format is compatible with Obsidian Bases.
The top-level `date` field on each day must be a `YYYY-MM-DD` ISO date — the date filter does fast lexicographic comparisons against this field.
## Development
```bash
npm install
npm run dev # esbuild watch mode
npm run build # production build
```
Source layout:
- `src/main.ts` — plugin entry point and settings tab
- `src/renderer.ts` — code-block processor, config parsing, date range filtering, and aggregate recomputation
- `src/data-loader.ts` — vault-aware data loader with cache invalidation
- `src/parsers/` — JSON, CSV, and Markdown parsers
- `src/visualizations/` — one file per chart type, plus `intro-stats.ts` (HTML)
- `src/canvas-utils.ts` — shared canvas helpers and color palettes
- `src/types.ts` — `HealthDay`, `VizConfig`, `HitRegion`, render-fn signatures
## License
MIT — see `package.json`.